Inside This Week’s Market Structure
Market-cap attribution and breadth review for the week ending 2026-07-10. Educational research only.
The headline index return rarely tells the full story. This weekly review looks at whether the market was carried by the largest companies or supported by broader participation underneath the surface.
Savior’s Take
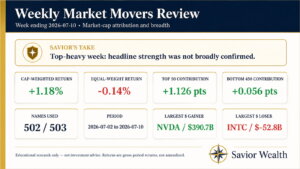
This was a top-heavy week. the top 50 contributed +1.131 percentage points, while the bottom 450 contributed +0.043 percentage points, which is technically positive but essentially flat. Because equal weight was -0.17%, the average stock did not confirm the strength in the largest names. The right read is concentrated leadership, not broad participation.
- The top 50 carried nearly all of the weekly contribution.
- The bottom 450 were technically positive but essentially flat, so this was not a strong breadth confirmation.
- Equal weight was negative even though the cap-weighted read was positive, showing the average stock did not confirm the headline.
What Moved the Market This Week
The key split is the difference between the top 50 companies and the bottom 450. If the top 50 dominate while the bottom 450 are flat or negative, the market can look better at the headline level than it feels beneath the surface.
Breadth Read
The top 50 contributed +1.131 percentage points. The bottom 450 contributed +0.043 percentage points. When the bottom 450 are barely positive or negative while equal weight lags, that is not a clean broad-market confirmation.
Top Positive Weekly Contributors
| Name | Return | Mkt Cap Change | Contribution |
|---|---|---|---|
| NVDA Nvidia |
+8.28% | $390.7B | +0.540 percentage points |
| META Meta Platforms |
+14.81% | $219.1B | +0.303 percentage points |
| AVGO Broadcom |
+10.96% | $188.0B | +0.260 percentage points |
| AAPL Apple Inc. |
+2.17% | $98.3B | +0.136 percentage points |
| AMD Advanced Micro Devices |
+7.74% | $65.3B | +0.090 percentage points |
| TSLA Tesla, Inc. |
+3.64% | $53.7B | +0.074 percentage points |
Top Negative Weekly Contributors
| Name | Return | Mkt Cap Change | Contribution |
|---|---|---|---|
| INTC Intel |
-8.73% | $-52.8B | -0.073 percentage points |
| MSFT Microsoft |
-1.38% | $-40.0B | -0.055 percentage points |
| GOOGL Alphabet Inc. (Class A) |
-0.76% | $-33.3B | -0.046 percentage points |
| BRK-B Berkshire Hathaway |
-2.77% | $-30.3B | -0.042 percentage points |
| V Visa Inc. |
-3.63% | $-25.0B | -0.035 percentage points |
| ABBV AbbVie |
-4.98% | $-23.0B | -0.032 percentage points |
The Bottom Line
This week should be read through concentration. The largest companies mattered most, while the broader market offered weaker confirmation. That does not mean the market cannot keep rising, but it does mean participation deserves close attention.