

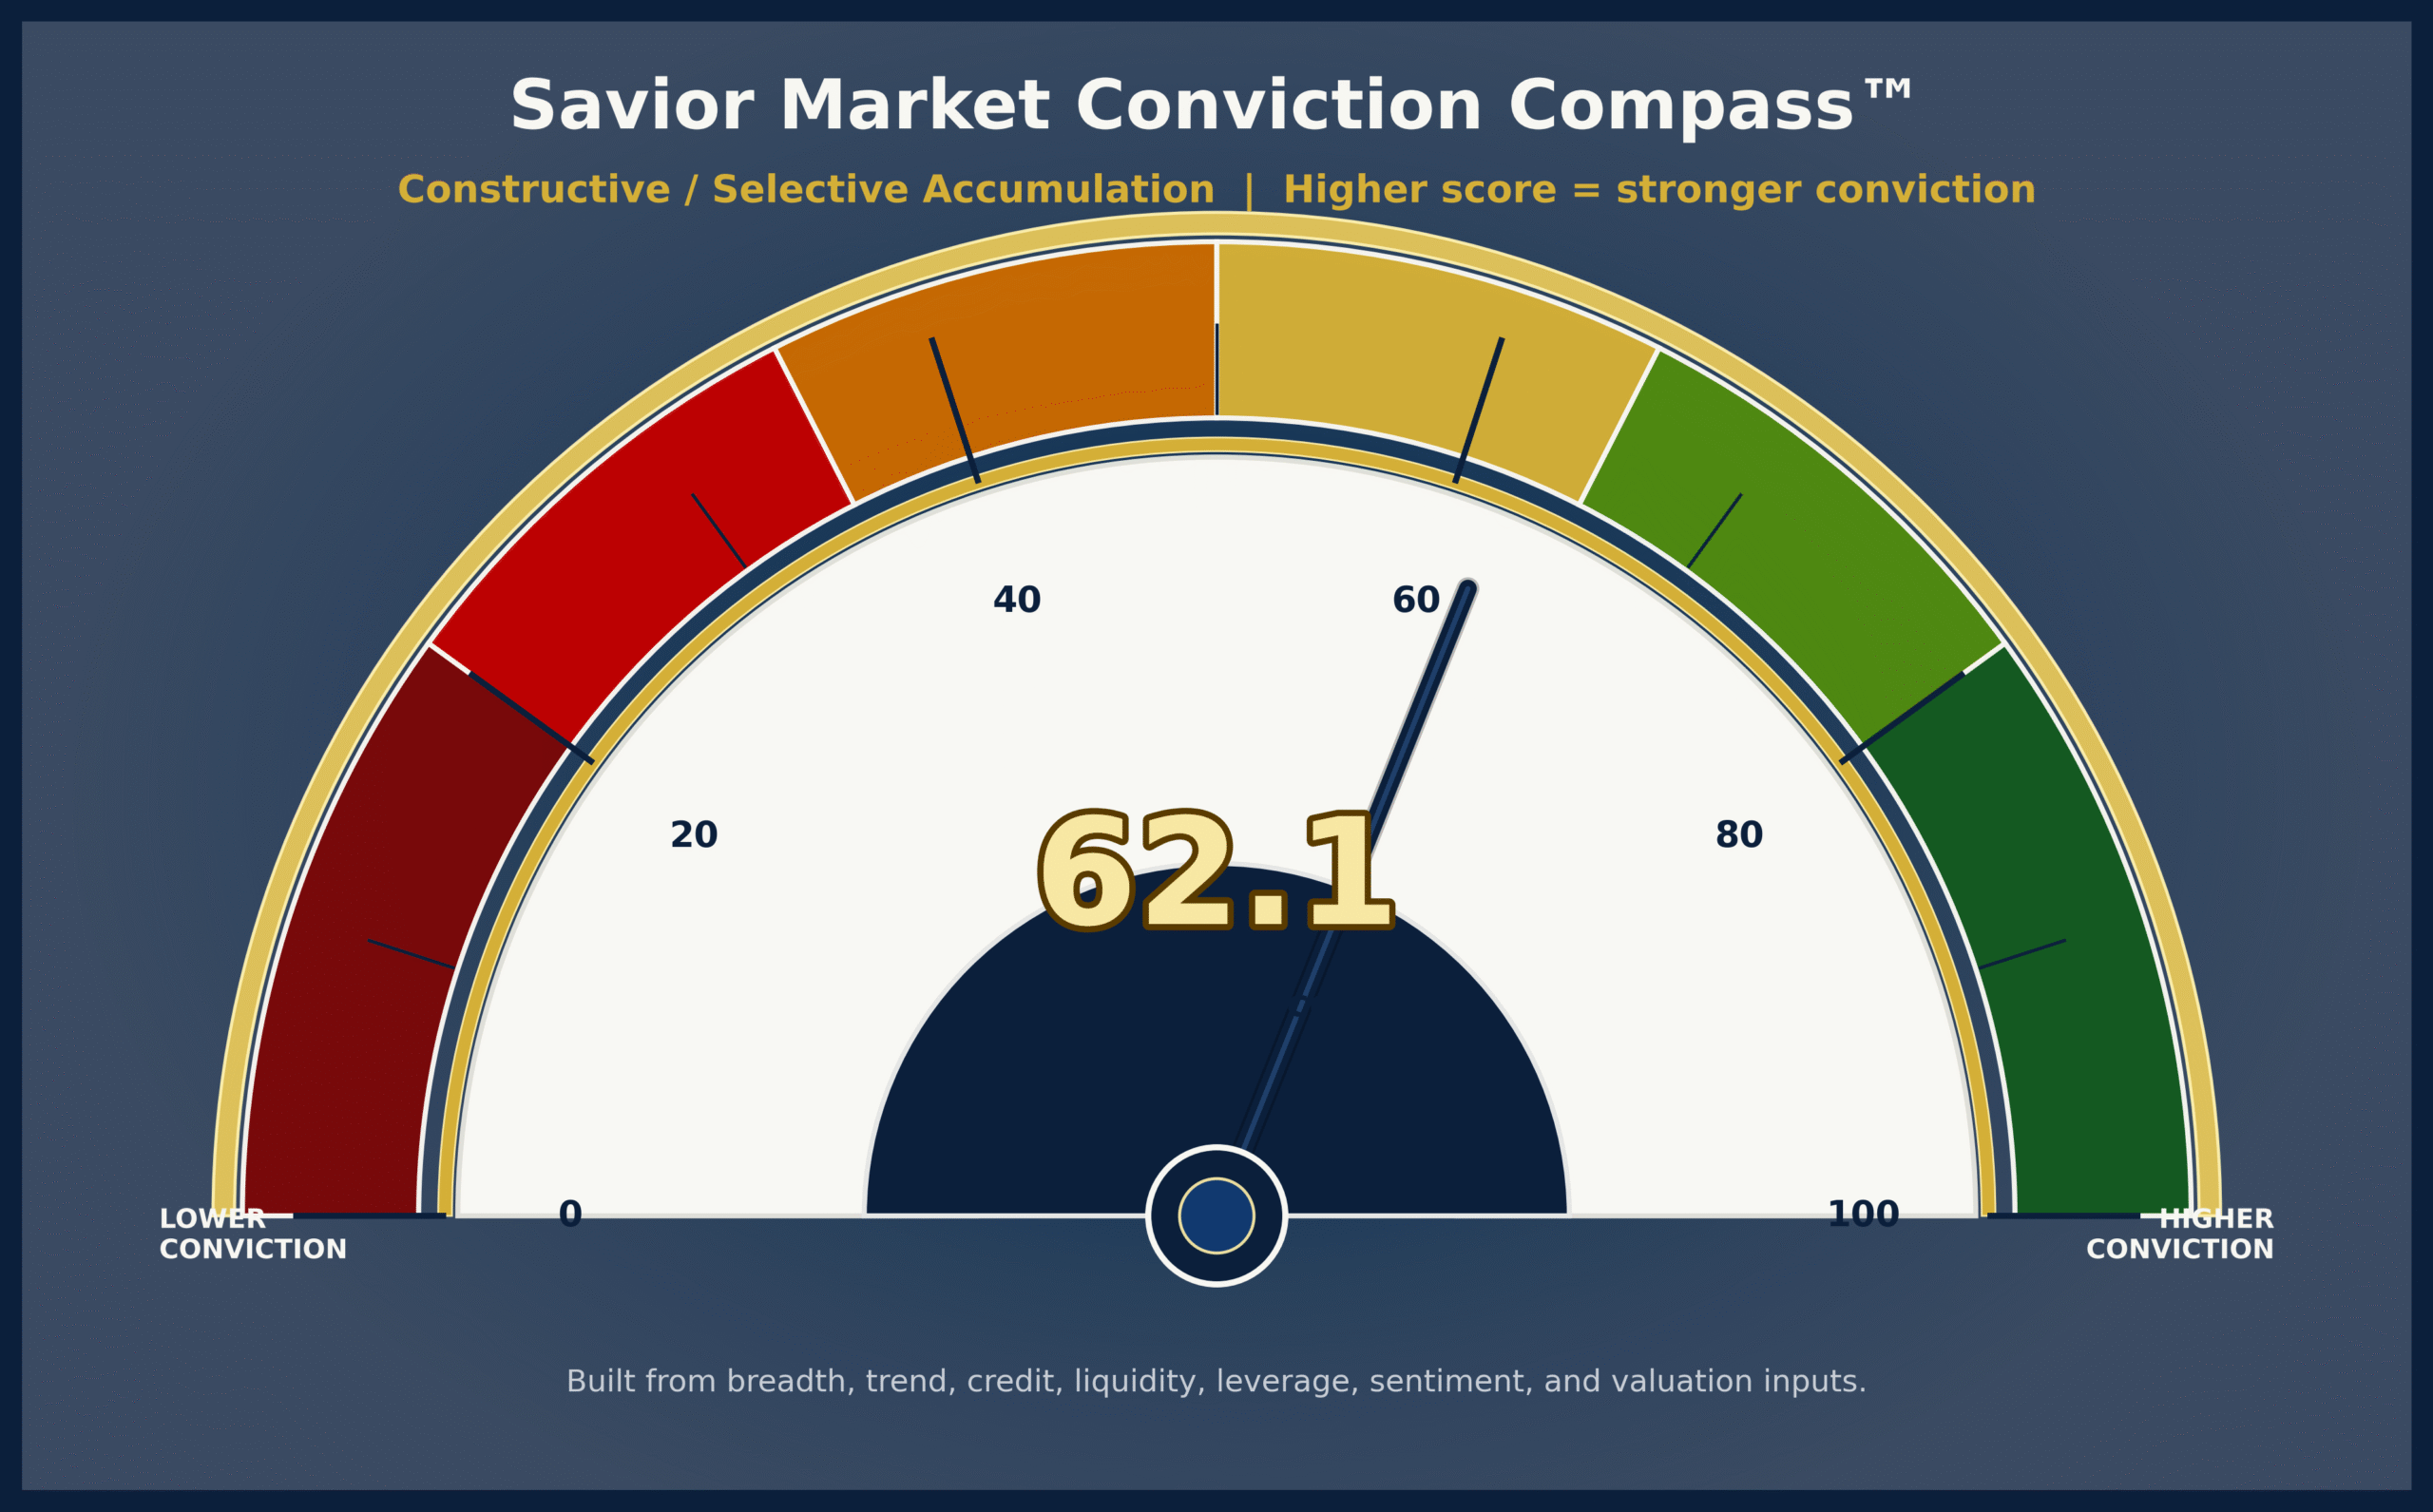
Constructive / Selective Accumulation.
Supportive backdrop, with continued selectivity and confirmation.
Savior Market Conviction Compass Dashboard
Higher Compass readings indicate stronger conviction to own risk assets.
Lower readings indicate reduced conviction and a greater emphasis on discipline, selectivity, and risk management.
The detailed Compass interpretation follows below, including key news highlights, asset-class movement, strongest and weakest dashboard areas, and selected public indicator readings.
Market Snapshot
These readings provide context for the daily Compass read. The dashboard is not based on price alone, but price movement helps frame how investors are reacting across equities, bonds, commodities, and interest rates.
Quote refresh timestamp based on yfinance. Latest available data date: 2026-07-10.
The futures section above shows overnight, pre-market, or after-hours activity where available.
Futures snapshot as of July 10, 2026 at 10:05 PM ET. Futures are shown for context only and may change before the cash market opens.
| Market | Latest | Latest Completed Day | Previous Completed Day | 5 Trading Days | Prior Week | YTD |
|---|---|---|---|---|---|---|
| S&P 500 SPY Quote / ChartState Street SPDR S&P 500 ETF TrustLarge-cap U.S. equity benchmark ETF |
754.95 | +0.43% | +0.85% | +1.37% | +2.17% | +11.09% |
| Nasdaq 100 QQQ Quote / ChartInvesco QQQ TrustNasdaq 100 growth and technology-heavy ETF |
725.51 | +0.31% | +1.66% | +1.81% | +0.86% | +18.61% |
| Emerging Markets EEM Quote / ChartiShares MSCI Emerging Markets ETFEmerging markets equity ETF |
66.90 | +0.18% | +0.83% | +1.83% | -2.22% | +19.57% |
| Russell 2000 IWM Quote / ChartiShares Russell 2000 ETFRussell 2000 small-cap U.S. equity ETF |
295.99 | -0.42% | +1.28% | -0.53% | -0.75% | +19.47% |
| U.S. Mid Cap SCHM Quote / ChartSchwab U.S. Mid-Cap ETFU.S. mid-cap equity ETF |
35.81 | -0.03% | +1.56% | -0.44% | -0.61% | +18.13% |
| Long-Term Treasuries TLT Quote / ChartiShares 20+ Year Treasury Bond ETFLong-term U.S. Treasury bond ETF |
84.47 | -0.02% | +0.15% | -1.22% | -1.76% | -0.74% |
| Core Aggregate Bonds AGG Quote / ChartiShares Core U.S. Aggregate Bond ETFCore U.S. aggregate bond ETF |
98.08 | -0.10% | +0.14% | -0.54% | -0.40% | +0.19% |
| 1-3 Month T-Bills BIL Quote / ChartSPDR Bloomberg 1-3 Month T-Bill ETFShort-term Treasury bill ETF / cash proxy |
91.50 | +0.04% | +0.01% | +0.07% | +0.09% | +1.84% |
| Gold GLD Quote / ChartSPDR Gold SharesGold bullion ETF |
377.01 | -0.31% | +1.00% | -0.30% | +1.20% | -5.34% |
| Silver SLV Quote / ChartiShares Silver TrustSilver bullion ETF |
53.95 | -0.35% | +2.48% | -1.94% | +3.27% | -17.95% |
| WTI Crude Oil CL=F Quote / ChartWTI Crude Oil FuturesWTI crude oil futures |
71.51 | -0.79% | -1.96% | +4.11% | -0.78% | +24.76% |
| U.S. Dollar Index DX-Y.NYB Quote / ChartU.S. Dollar IndexU.S. Dollar Index |
100.96 | +0.02% | -0.11% | +0.10% | -0.49% | +2.59% |
| 10-Year Treasury Yield DGS10 Quote / Chart10-Year U.S. Treasury Yield10-year U.S. Treasury yield |
4.57 | +0.03% | -0.03% | +0.09% | +0.11% | +0.38% |
Daily Market Intelligence
Important News We Are Watching
These high-priority stories are included for additional market context around risk, policy, valuation, credit, AI, liquidity, and macro conditions.
Savior Wealth: Leverage and Margin Risk — 1929 vs Today
Why we are watching: This internal article gives readers a deeper educational follow-up on why leverage can amplify downside volatility and why margin risk deserves attention even when markets look calm.
Market impact to monitor: Use as the featured internal resource whenever the dashboard discusses leverage, margin debt, financing costs, or market fragility.
Educational resource: Velocity of M2 Money Stock
Why we are watching: This is a useful educational resource for a future Savior article explaining M2, GDP, and money velocity. It can help readers understand whether dollars are circulating faster or slower through the economy.
Market impact to monitor: Use as background for the planned inflation, oil, M2, GDP, and velocity-of-money Insight article.
Market News Highlight
Asian stocks rally as AI gains outweigh Middle East concerns (Profit by Pakistan Today)
Related headlines:
- Asian stocks rally as AI gains outweigh Middle East concerns (Profit by Pakistan Today)
- Asian stocks rally as AI gains outweigh Middle East concerns (Profit by Pakistan Today)
- Dow, Nasdaq, S&P 500 Futures Retreat After Chip-Led Gains At Close: META, ONDS, FUBO, FRMI Stocks In Focus (Yahoo Finance Markets)
- What Will Push This Market Into Its Next Gear? Maybe the $7 Trillion Cash Pile on the Sidelines. (Yahoo Finance Markets)
- S&P 500, Nasdaq, Dow End Higher Led By Chipmaker Stocks As Investors Look Past US-Iran Hostility — ORCL, SBUX, WULF, PANW, FATE In Focus (Yahoo Finance Markets)
- Best 3 Vanguard Bond ETF Picks for the Second Half of 2026 (Yahoo Finance Markets)
Fresh Market Headlines
Fresh automated headlines for current market context. These are separate from the high-priority Market Watch items above.
-
Asian stocks rally as AI gains outweigh Middle East concerns (Profit by Pakistan Today)
Fri, 10 Jul 2026 06:31:01 GMT
-
How Shifting Fed Policy and Rising Bond Yields Could Finally Crack the Stock Market (Barron’s)
Thu, 09 Jul 2026 12:01:00 GMT
-
Stock market today: Nasdaq rises, Dow and S&P 500 retreat as oil prices climb on renewed US-Iran tensions (Yahoo Finance)
Wed, 08 Jul 2026 20:01:37 GMT
-
AI memory stocks trim losses as investors buy the dip (Yahoo Finance)
Wed, 08 Jul 2026 19:29:15 GMT
-
Fed officials were split on direction of interest rates at last meeting, minutes show (CNBC)
Wed, 08 Jul 2026 18:00:53 GMT
-
Stock Market Today: S&P 500 7,499, Nasdaq 25,960 Rise as Micron Rips 6%, Ionis Craters 21%, Dow Recovers From 577-Point Iran Drop (TradingNEWS)
Thu, 09 Jul 2026 16:05:16 GMT
-
Oil Prices Spike Again, But Stock Markets Face a Bigger Risk Now (tastylive)
Thu, 09 Jul 2026 09:13:14 GMT
-
AI Semiconductor Stocks July 2026: NVDA vs AMD Investment Analysis (Intellectia AI)
Thu, 09 Jul 2026 02:22:11 GMT
Headline scan generated: 2026-07-10T06:30:58
Summary
The Savior Market Conviction Compass™ is a rules-based market risk and conviction framework
from Savior Wealth. The current public reading is 62.1/100,
signaling a Constructive / Selective Accumulation posture.
The framework reviews market breadth, price trend, credit and funding conditions,
volatility, valuation, leverage, sentiment, and macro/rates policy signals.
Higher Compass readings indicate stronger conviction to own risk assets.
Lower readings indicate reduced conviction and a greater emphasis on discipline,
selectivity, and risk management.
Generated: 2026-07-10
What We’re Watching
- Whether breadth improves or continues narrowing.
- Whether credit spreads remain calm.
- Whether rates, oil, and the dollar pressure valuation or sentiment.
- Whether AI and mega-cap leadership remain confirmed by participation.
Savior’s Take
Friday update: today’s dashboard focuses on whether fresh news and market internals are confirming or challenging the prior weekly setup. The Compass currently reads 62.12/100 — Constructive / Selective Accumulation. The latest reading can also be compared with the prior published full Insight reading of 64.4/100, a change of +1.60 points. The strongest dashboard area is Credit & Funding, while the weakest area is Valuation / Fundamentals. That combination matters because a market can look stable at the headline-index level while individual internals send a more mixed message. This is not a recommendation; it is a disciplined framework for watching what is supporting markets, what is pressuring markets, and what could change next. Market Watch: Savior Wealth: Leverage and Margin Risk — 1929 vs Today (Savior Wealth) — This internal article gives readers a deeper educational follow-up on why leverage can amplify downside volatility and why margin risk deserves attention even when markets look calm. Market impact to monitor: Use as the featured internal resource whenever the dashboard discusses leverage, margin debt, financing costs, or market fragility.
What Is Supporting Markets
- Volatility remains relatively subdued, suggesting investors are not yet aggressively hedging downside risk.
- Corporate credit spreads remain relatively calm, meaning bond markets are not yet signaling broad financial stress.
What Is Pressuring Markets
- Margin debt remains elevated, which can amplify downside volatility during periods of market stress.
- The Buffett Indicator remains near historically elevated levels, suggesting market value is high relative to the size of the economy.
- Price-to-sales ratios remain historically stretched, leaving less room for disappointment.
Why It Matters
- The Compass is designed to identify changes in market conviction before volatility and headlines fully catch up.
Dashboard Area Context
| Area | Score | What This Means | What Changed | Trend Meaning |
|---|---|---|---|---|
| Credit & Funding | 87.1/100 | Supportive. Credit and funding conditions show whether bond markets are confirming or rejecting equity-market stress. | Since 2026-05-06, this area moved from 81.2/100 to 87.1/100 (+5.95). | Improving. This dashboard area is adding more support than it did at the reference point. |
| Volatility / Dealer / Options | 83.6/100 | Supportive. Volatility and options conditions help show whether markets are calm, hedged, or vulnerable to fast moves. | Since 2026-05-06, this area moved from 63.6/100 to 83.6/100 (+19.98). | Improving. This dashboard area is adding more support than it did at the reference point. |
| Breadth & Structure | 72.9/100 | Supportive. Breadth shows whether many stocks are participating or whether the market is being carried by narrow leadership. | Since 2026-05-06, this area moved from 45.0/100 to 72.9/100 (+27.90). | Improving. This dashboard area is adding more support than it did at the reference point. |
| Valuation / Fundamentals | 9.3/100 | Pressuring. Valuation is usually not a timing tool, but it affects how much room the market has for disappointment. | Since 2026-05-06, this area moved from 17.4/100 to 9.3/100 (-8.15). | Deteriorating. This dashboard area is adding less support than it did at the reference point. |
| Leverage / Fragility | 33.5/100 | Pressuring. Leverage can amplify downside if prices fall quickly or volatility rises. | Since 2026-05-06, this area moved from 34.5/100 to 33.5/100 (-1.02). | Little changed. This area is broadly similar to the reference point. |
| Sentiment & Hedging | 35.6/100 | Pressuring. Sentiment and hedging help show whether investors are complacent, fearful, or already protected. | Since 2026-05-06, this area moved from 42.1/100 to 35.6/100 (-6.46). | Deteriorating. This dashboard area is adding less support than it did at the reference point. |
Key Individual Indicator Readings
These public-facing readings explain some of the strongest and weakest inputs behind today’s Compass read.
| Indicator | Latest | What It Is | What This Reading Means | What Changed | Trend Meaning |
|---|---|---|---|---|---|
| High Yield OAS Source / chart: FRED Credit & Funding |
2.7 | The extra yield investors demand to own high-yield bonds versus Treasuries. | A high-yield spread of 2.70% remains relatively contained. Credit is not yet confirming broad financial stress, which is an important support. | Since 2026-05-16, this input moved from 2.76 to 2.70 (-0.06). | Little changed. The scored contribution is broadly similar to the reference point. |
| Investment Grade OAS Source / chart: FRED Credit & Funding |
0.76 | The extra yield investors demand to own investment-grade corporate bonds versus Treasuries. | An investment-grade spread of 0.76% remains tight. That suggests higher-quality credit markets are still functioning normally. | Since 2026-05-16, this input moved from 0.76 to 0.76 (0.00). | Little changed. The scored contribution is broadly similar to the reference point. |
| Dealer Gamma $bn Volatility / Dealer / Options |
$8.0B | Dealer gamma is an estimate of how options-market dealer positioning may influence short-term market movement. Positive gamma can help dampen moves as dealers rebalance against price swings; falling or negative gamma can make moves faster and less orderly. | The current reading suggests options positioning is still acting as a stabilizing input, but it should not be treated as permanent support. If volatility rises and gamma support fades, intraday market moves can become more exaggerated. | Since 2026-05-06, this input moved from 30.0 to 8.00 (-22.00). | Improving. The scored contribution is more supportive for risk-asset conviction than it was at the reference point. |
| CTA Positioning Score Sentiment & Hedging |
87.6/100 | CTA positioning is a rules-based estimate of systematic trend-following exposure. CTAs and similar strategies often add exposure when trends are strong and reduce or reverse exposure when trend signals break. | A high reading suggests systematic investors may already be heavily positioned with the prevailing trend. That can help support the market while the trend holds, but it also means a trend break can turn a supportive flow into a source of selling pressure. | Since 2026-05-06, this input moved from 25.0 to 87.6 (+62.62). | Deteriorating. The scored contribution is less supportive and deserves closer monitoring. |
| Margin Debt YoY % Source / chart: FINRA Leverage / Fragility |
+53.3% | Margin Debt YoY % measures how quickly investor borrowing through margin accounts is growing versus the prior year. It is a risk-appetite and leverage-growth gauge, not a precise market-timing tool. | A high positive year-over-year reading means borrowing has expanded quickly. That can support upside while markets rise, but it can also leave less cushion if prices fall, because forced deleveraging and margin calls may amplify downside moves. | Since 2026-05-06, this input moved from 16.0 to 53.3 (+37.34). | Deteriorating. The scored contribution is less supportive and deserves closer monitoring. |
| Margin Debt $bn Source / chart: FINRA Leverage / Fragility |
$1.30T (1,304B) | FINRA margin debt is the dollar amount customers have borrowed in brokerage margin accounts, typically secured by securities. In plain English, it is borrowed money tied to investment portfolios and often used to buy or hold stocks. | High margin debt can reflect confidence and add buying power during rising markets. The risk is that falling prices can trigger margin calls, collateral pressure, or forced selling. Historically, margin debt often rises into major risk-on periods and can peak near important market tops, so the Compass treats it as a fragility gauge rather than a short-term prediction. | Since 2026-05-06, this input moved from 1,214 to 1,304 (+90.28). | Deteriorating. The scored contribution is less supportive and deserves closer monitoring. |
| Securities-Based Lending (SBL) Leverage / Fragility |
$1.05T context estimate | Securities-based lending is borrowing against an investment portfolio. It is often used for liquidity, real estate, taxes, or spending needs rather than directly buying stocks. | SBL can still create market fragility because the collateral is tied to portfolio values. If markets fall, lenders can require more collateral, principal paydowns, or liquidations at bad times. This is why SBL belongs in the broader leverage dashboard even when it is not classic margin debt. | More history needed. | Trend will appear after more dashboard runs. |
| Total Combined Leverage Leverage / Fragility |
$9.364T / 31.7% GDP context estimate | Total combined leverage is a broader context estimate that combines classic margin borrowing with other modern leverage channels, including securities-based lending and derivatives-related exposure. | This broader measure matters because modern leverage is more complex than the 1929 margin-loan story. The key risk is not one data series by itself; it is the combination of elevated borrowing, elevated asset prices, and a catalyst that forces investors to reduce risk at the same time. | More history needed. | Trend will appear after more dashboard runs. |
| Real GDP Macro / Rates / Policy |
$24.18T chained 2017 dollars; +2.1% annualized; ~+$508B annualized real-growth pace; -12.7% vs long-term trend | Real GDP is the inflation-adjusted size of the economy. In plain English, “real” means the GDP number has been adjusted for inflation, so it is trying to measure actual output rather than price increases. | At roughly $24.18 trillion in chained 2017 dollars, 2.1% annualized real growth equals roughly $508 billion of annualized inflation-adjusted growth, or about $127 billion for the quarter before compounding. The economy is still estimated at 12.7% below its long-term trend, which matters because valuation and leverage are easier to support when real growth is strong. | More history needed. | Trend will appear after more dashboard runs. |
| Inflation Context (Core PCE / Core CPI) Macro / Rates / Policy |
Core PCE 3.4%; Core CPI 2.9%; Fed target 2.0% | Inflation measures how much of economic growth and price movement comes from higher prices rather than more real output. PCE is the Federal Reserve’s preferred inflation gauge, while CPI is the more familiar household inflation gauge. | Core PCE at 3.4% and core CPI at 2.9% are still above the Fed’s 2% target. That matters because sticky inflation can keep policy tighter, pressure bond yields, and reduce the valuation support that stocks receive from falling rates. | More history needed. | Trend will appear after more dashboard runs. |
| Buffett Indicator % Source / chart: Advisor Perspectives Valuation / Fundamentals |
229.7% | The Buffett Indicator compares total U.S. equity-market value to the size of the economy. It is a broad valuation gauge, not a short-term timing model. | A high reading means the equity market is expensive relative to GDP. That does not mean stocks must fall immediately, but it does mean future returns become more dependent on earnings growth, liquidity, and investor willingness to keep paying high multiples. | Since 2026-05-06, this input moved from 220.1 to 229.7 (+9.62). | Deteriorating. The scored contribution is less supportive and deserves closer monitoring. |
| S&P 500 P/S Source / chart: Multpl Valuation / Fundamentals |
3.65x sales | The S&P 500 price-to-sales ratio shows how much investors are paying for each dollar of company revenue. | A high price-to-sales ratio leaves less margin for disappointment. If revenue growth, margins, or liquidity weaken, expensive sales multiples can compress even if the economy avoids recession. | Since 2026-05-06, this input moved from 3.43 to 3.65 (+0.22). | Deteriorating. The scored contribution is less supportive and deserves closer monitoring. |
| VIX Source / chart: Cboe Volatility / Dealer / Options |
15.94 | The market’s expected volatility level implied by S&P 500 options. | A VIX reading of 15.9 suggests volatility expectations remain contained. Calm volatility can support markets, but it can also mask complacency if breadth weakens. | Since 2026-05-06, this input moved from 14.8 to 15.9 (+1.09). | Improving. The scored contribution is more supportive for risk-asset conviction than it was at the reference point. |
Leverage, Valuation & Growth Context
Margin debt, securities-based lending, CTA positioning, valuation, real GDP, and inflation should be read together. None of them is a standalone market-timing signal. Together, they help show whether the market has enough underlying support to absorb disappointment or whether elevated leverage, valuation, and inflation could amplify a reversal.
Borrowed money in brokerage margin accounts can increase buying power as markets rise. The downside is that falling prices can trigger margin calls, collateral pressure, and forced selling. Historically, margin debt often expands into strong bull markets and can peak near important risk-on periods.
SBL is broader than classic margin debt. It may fund liquidity, property, taxes, or spending needs, but the collateral is still an investment portfolio. A market decline can create paydown or collateral demands even when the loan was not used to buy stocks.
CTA and systematic trend-following exposure can support markets while trends remain intact. If trend levels break, the same strategies can become a source of mechanical selling.
High valuation alone rarely causes a decline. High leverage alone may persist for years. The risk increases when elevated valuation and elevated leverage meet a catalyst such as tighter credit, rising volatility, or weakening growth.
Real GDP is the inflation-adjusted size of the economy. At about $24.18T in chained 2017 dollars, 2.1% annualized growth equals roughly $508B of annualized real growth or about $127B for the quarter before compounding. Real growth matters because it supports earnings, credit quality, and valuation.
“Real” means after inflation. That distinction matters because nominal GDP can rise simply because prices are higher, while real GDP attempts to measure actual output. With core PCE at 3.4% and core CPI at 2.9%, inflation is still above the Fed’s 2% target, which can keep rates higher and pressure valuation.
Source / chart links: Savior Wealth leverage and margin risk article | Advisor Perspectives / FINRA margin debt chart | Advisor Perspectives real GDP chart | FINRA margin statistics | FINRA securities-backed lines of credit | Advisor Perspectives PCE / CPI inflation chart
Educational context only. This section helps explain leverage, valuation, and growth conditions; it does not change the Compass score calculation by itself.
Research Context and Data Sources
The Compass uses a rules-based process that incorporates market data, macro data, valuation data,
credit conditions, volatility, and market internals.
Use the Compass Two Ways
Subscribe to the Compass
For investors who want ongoing market interpretation, weekly updates, and deeper dashboard commentary.
Private Discovery Session
For qualified families and business owners interested in becoming a Savior Wealth client rather than managing this alone.
Important Disclosures
This material is for informational and educational purposes only and should not be considered individualized
investment advice, a recommendation to buy or sell any security, or a guarantee of future results.
Investing involves risk, including possible loss of principal. Past performance does not guarantee future results.
Market indicators are imperfect, may change quickly, and should be evaluated within the context of an investor’s
objectives, time horizon, liquidity needs, risk tolerance, and overall financial plan.
Savior Wealth does not provide tax or legal advice. Please consult your tax, legal, or other professional advisor
regarding your specific circumstances.
Additional disclosures are available here:
https://www.saviorwealth.com/important-disclosures/