
Market Movers Week in Review: What Moved the S&P 500 Under the Hood
Week through 2026-07-02. Generated 2026-07-03T10:08:53.
Daily market moves can be noisy. A weekly attribution view helps show whether the same leadership themes are carrying through several sessions or whether participation is rotating beneath the headline index.
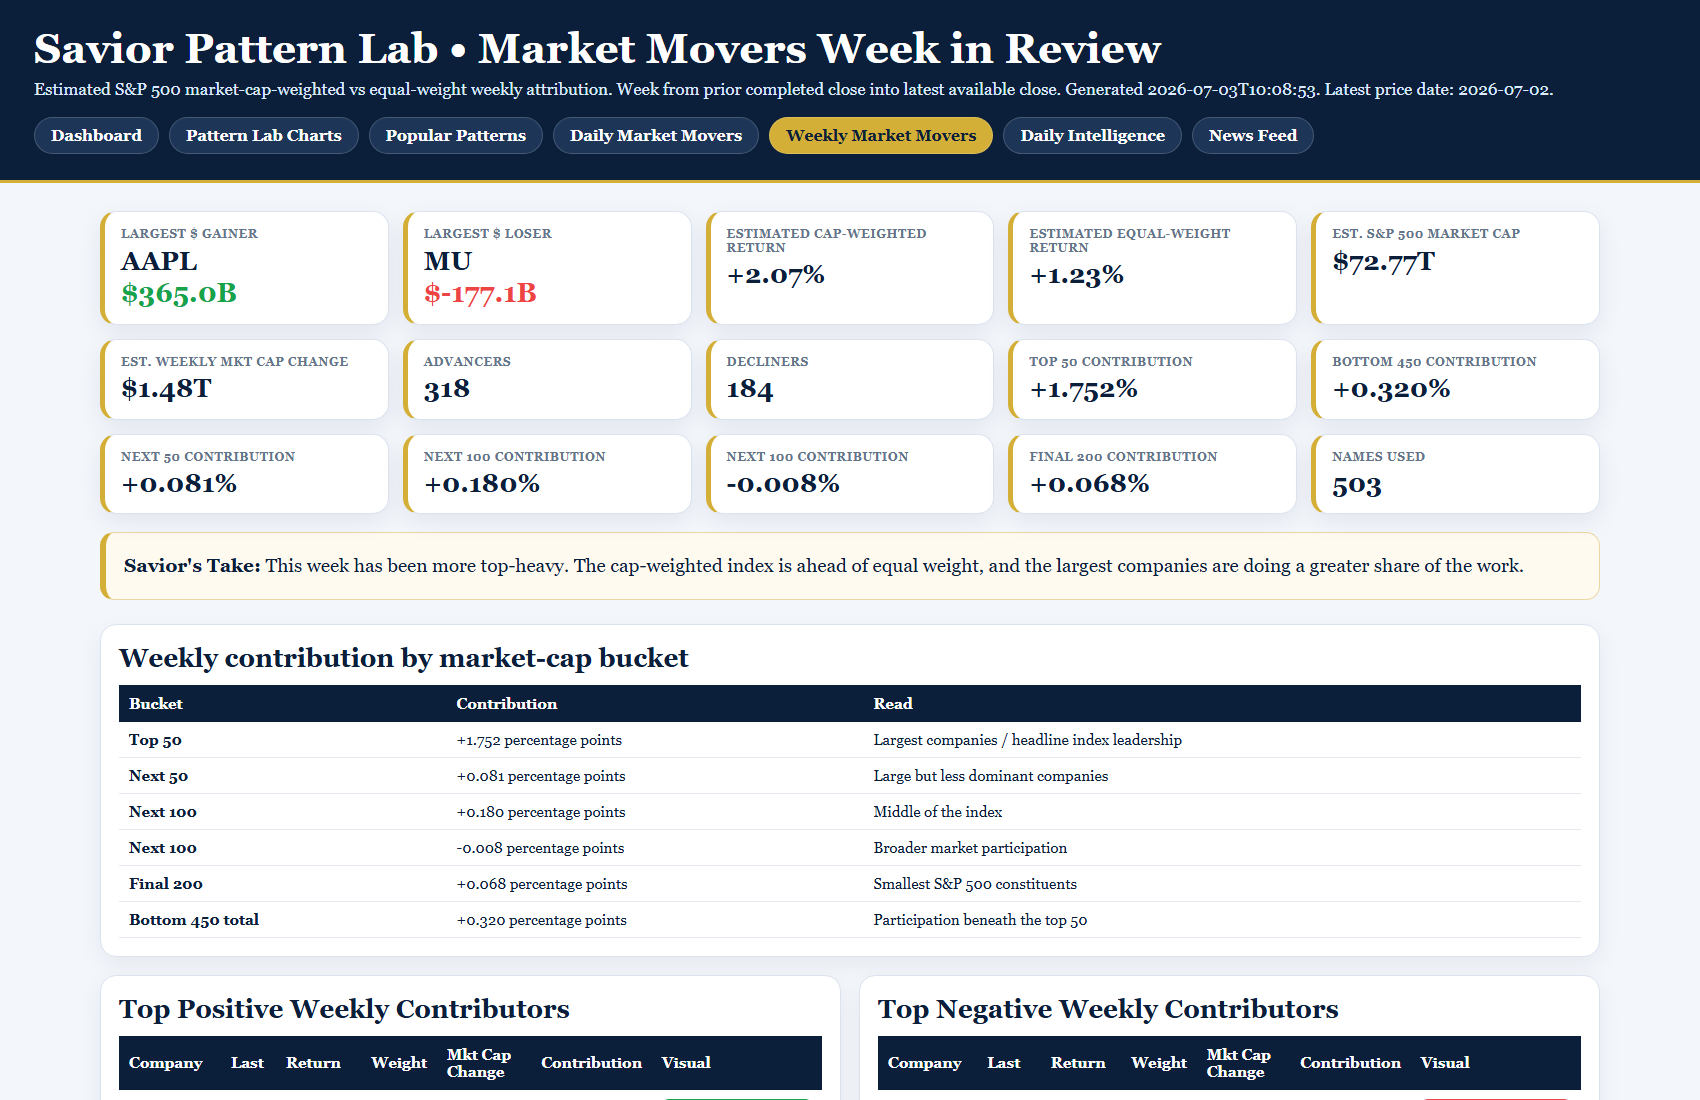
| Estimated cap-weighted weekly return | +2.07% |
| Estimated equal-weight weekly return | +1.23% |
| Top 50 contribution | +1.752 percentage points |
| Bottom 450 contribution | +0.320 percentage points |
| Largest dollar gainer | AAPL / $365.0B |
| Largest dollar loser | MU / $-177.1B |
Weekly Market Movers Snapshot
Why this matters
If the top 50 companies carry most of the week, leadership is more concentrated. If the bottom 450 contribute positively, the rally has broader participation underneath. That distinction matters because a market can look strong at the headline level while fewer stocks participate, or it can look modest while the average stock is improving beneath the surface.
Pattern Lab uses this kind of attribution work alongside trend, breadth, support/resistance, and technical pattern research to better understand what is driving the market.
Educational commentary only. This material is not investment advice and is not a recommendation to buy or sell any security. Market-cap attribution is estimated using public data and may differ from official index calculations.