
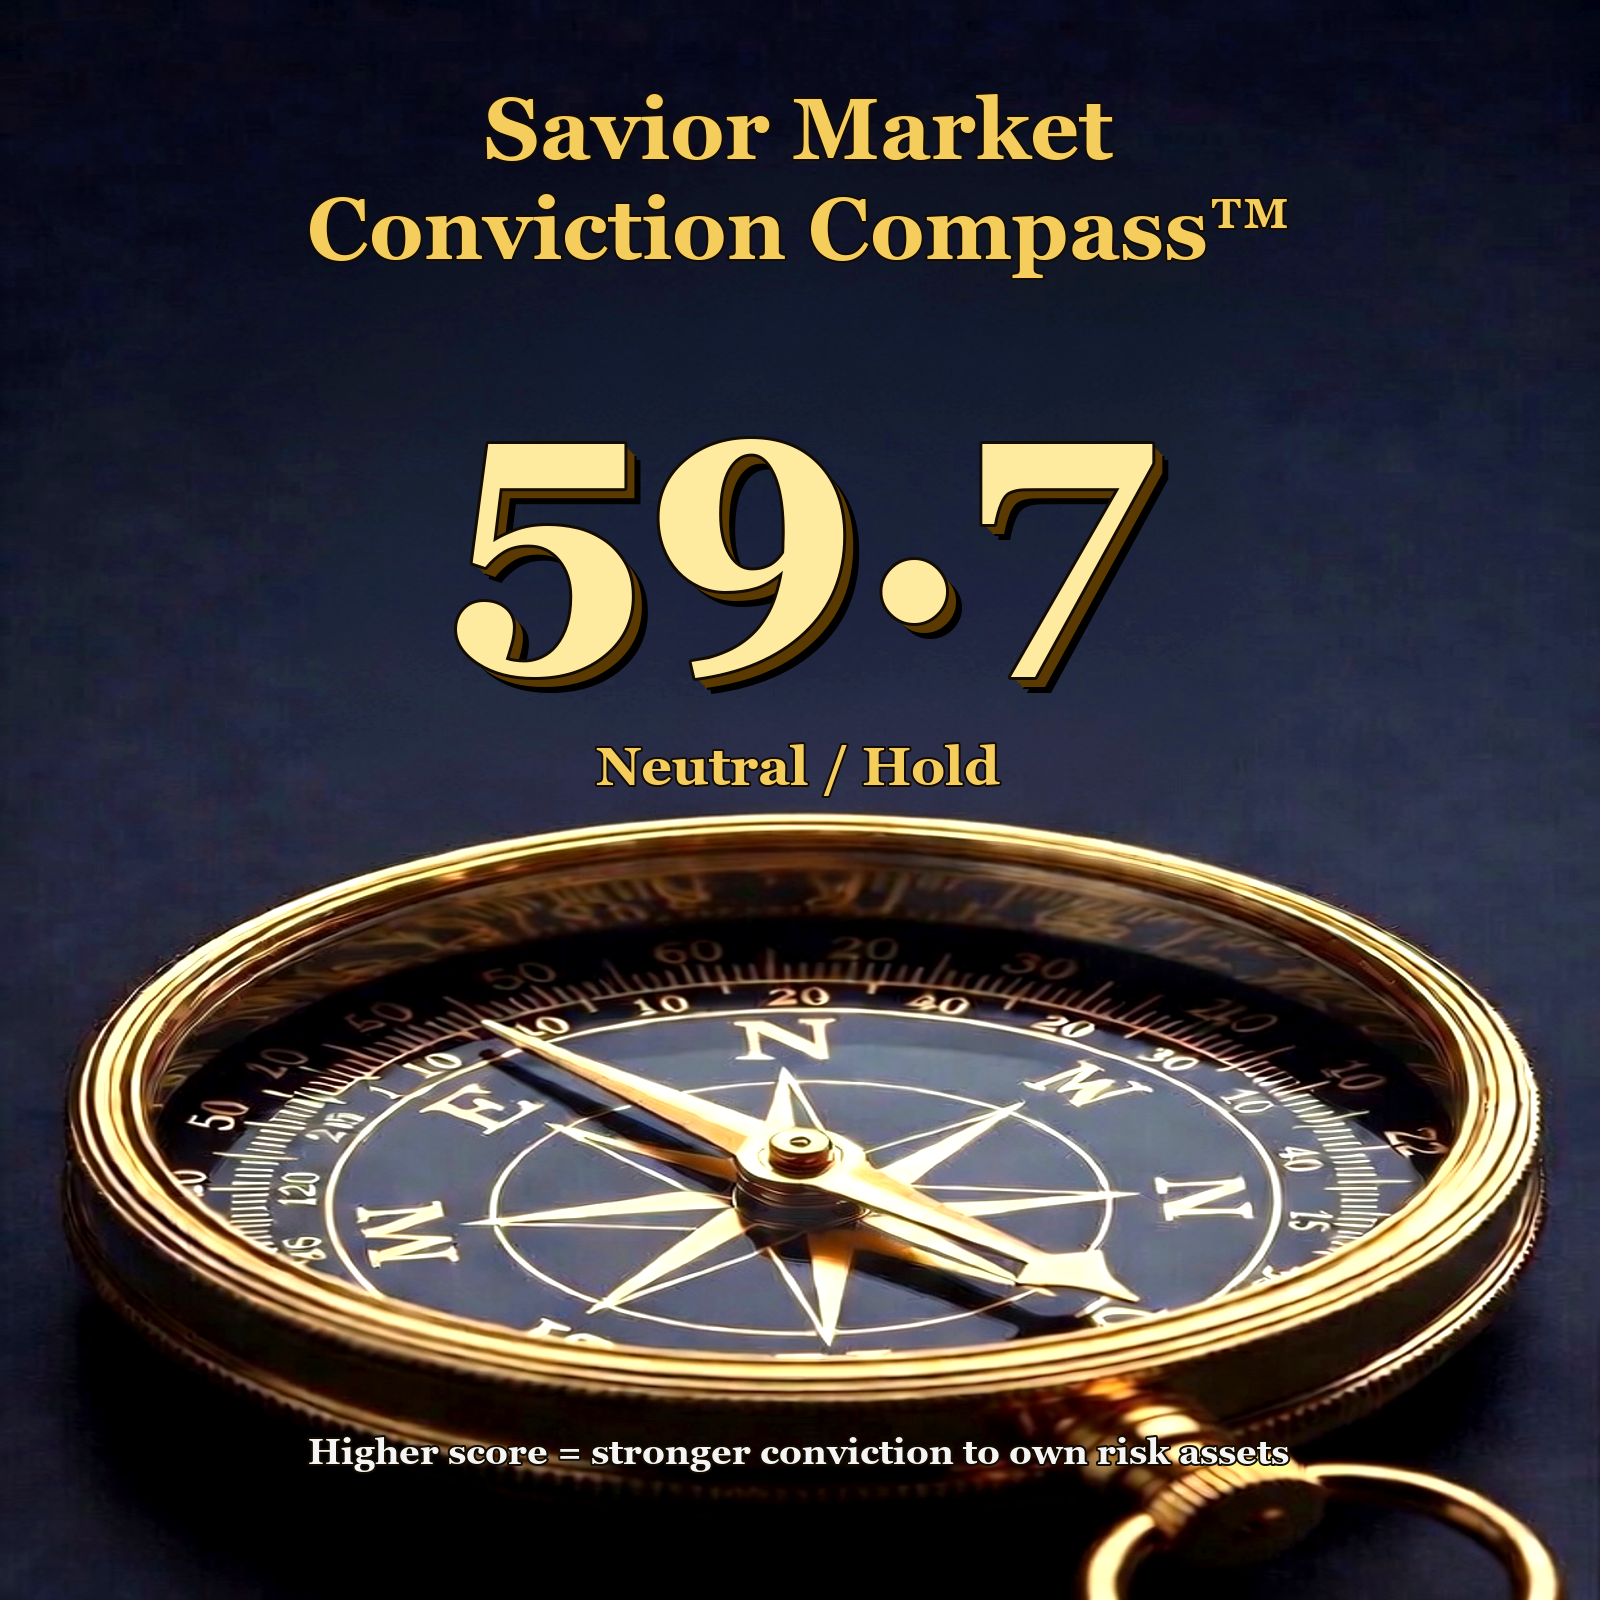
59.7/100 — Neutral / Hold
Prior weekly reference: 62.1/100 — Constructive / Selective Accumulation.
Week-over-week change: -2.4 points.
Plain English: The Compass moved back into a Neutral / Hold posture. The message is not panic; it is confirmation, selectivity, and risk control while we watch whether credit, volatility, and breadth confirm deeper stress.
Rules-Based Market Conviction Framework
Tracking breadth, trend, credit, liquidity, leverage, sentiment, valuation, volatility, and macro/rate conditions.
1. What Changed
The prior published weekly reading was 62.1/100, so the week-over-week change was -2.4 points.
The important part: the score moved from constructive back into neutral territory. That does not mean downside is guaranteed. It means the market is asking for confirmation: broader participation, calm credit, contained volatility, and evidence that AI/semiconductor weakness does not spread into a broader risk-off move.
2. Major Asset Class Snapshot — Daily and Weekly View
The table below is intentionally more complete than the daily dashboard. It shows each completed trading day, the full current week, and the prior week so readers can see where pressure actually appeared.
| Asset Class | Latest | Mon 07/13 | Tue 07/14 | Wed 07/15 | Thu 07/16 | Fri 07/17 | This Week | Prior Week |
|---|---|---|---|---|---|---|---|---|
| S&P 500 SPY Large-cap U.S. equity benchmark ETF |
743.29 2026-07-17 |
-0.77% | +0.36% | +0.40% | -0.54% | -0.99% | -1.54% | +1.37% |
| Nasdaq 100 QQQ Nasdaq 100 growth and technology-heavy ETF |
695.33 2026-07-17 |
-1.90% | +1.12% | -0.27% | -1.64% | -1.50% | -4.16% | +1.81% |
| Russell 2000 IWM Small-cap U.S. equity ETF |
294.04 2026-07-17 |
-0.85% | +0.35% | +0.43% | -0.06% | -0.52% | -0.66% | -0.53% |
| U.S. Mid Cap SCHM U.S. mid-cap equity ETF |
34.99 2026-07-17 |
-1.20% | +0.54% | -0.53% | -0.54% | -0.57% | -2.29% | -0.44% |
| Emerging Markets EEM Emerging markets equity ETF |
63.29 2026-07-17 |
-3.59% | +1.81% | -0.15% | -2.10% | -1.40% | -5.40% | +1.83% |
| Long-Term Treasuries TLT Long-term U.S. Treasury bond ETF |
84.52 2026-07-17 |
-0.59% | +0.13% | +0.19% | -0.04% | +0.37% | +0.06% | -1.22% |
| Core Aggregate Bonds AGG Core U.S. aggregate bond ETF |
98.20 2026-07-17 |
-0.38% | +0.30% | +0.14% | -0.01% | +0.07% | +0.12% | -0.54% |
| 1-3 Month T-Bills BIL Short-term Treasury bill / cash proxy ETF |
91.55 2026-07-17 |
+0.00% | +0.01% | +0.01% | +0.01% | +0.02% | +0.05% | +0.07% |
| Gold GLD Gold ETF |
368.41 2026-07-17 |
-2.62% | +1.37% | +0.05% | -1.98% | +0.95% | -2.28% | -0.30% |
| Silver SLV Silver ETF |
50.78 2026-07-17 |
-3.32% | +1.94% | -1.81% | -3.49% | +0.77% | -5.88% | -1.94% |
| WTI Crude Oil CL=F WTI crude oil futures |
82.49 2026-07-17 |
+9.42% | +1.54% | +0.33% | -0.82% | +4.48% | +15.52% | +3.96% |
| U.S. Dollar Index DX-Y.NYB U.S. dollar index |
100.75 2026-07-17 |
+0.31% | -0.34% | -0.44% | +0.23% | +0.02% | -0.22% | +0.11% |
| Cboe Volatility Index ^VIX Expected S&P 500 volatility |
18.77 2026-07-17 |
+14.17% | -3.85% | -5.03% | +6.76% | +12.19% | +24.88% | -6.93% |
Daily columns show completed trading-day close-to-close returns. “This Week” shows the full current week through the latest available close. “Prior Week” uses the same close-to-close convention for the prior completed week.
This Week’s News Context — Why the Update Matters Now
The weekly Compass Insight is designed to go deeper than the daily dashboard. The dashboard shows the current read; the weekly Insight explains what changed, why it matters, and what investors should watch next.
- AI and semiconductor pressure: chip and AI-linked stocks weakened, turning last week’s narrow leadership into this week’s key risk area.
- Geopolitical and oil risk: renewed Iran-related concerns pushed oil higher and can feed back into inflation expectations, rates, and risk appetite.
- Earnings season: the next test is whether corporate earnings and AI-capex commentary can support elevated valuation assumptions.
- Credit confirmation: credit spreads remain one of the most important lines between a normal equity pullback and broader financial stress.
Source links for review:
3. Weekly Market Movers / Pattern Lab
What Really Moved the Market Under the Hood
The headline index return rarely tells the full story. This weekly Market Movers review looks at whether the market was carried by the largest companies or supported by broader participation underneath the surface.
| Period | 2026-07-10 to 2026-07-17 |
| Names Used | 460 / 503 |
| Cap-Weighted Return | -1.75% |
| Equal-Weight Return | -0.41% |
| Top 50 Contribution | -1.304 percentage points |
| Bottom 450 Contribution | -0.446 percentage points |
| Largest $ Gainer | AAPL / $270.5B |
| Largest $ Loser | NVDA / $-197.4B |
Savior’s Take: This week showed broad pressure. The top 50 contributed -1.304 percentage points and the bottom 450 contributed -0.446 percentage points, while equal weight was -0.41%. Weakness was not isolated to a few large names.
Breadth read: The top 50 contributed -1.304 percentage points. The bottom 450 contributed -0.446 percentage points. When the bottom 450 are barely positive or negative while equal weight lags, that is not a clean broad-market confirmation.
Week-over-week connection: last week’s leadership was narrow and AI/semiconductor-heavy. This week, several of those same AI and chip leaders moved from leadership into pressure. That is exactly why we watch concentration and participation, not just headline index returns.
Read more on the Insights page
Weekly Contribution by Market-Cap Bucket
| Bucket | Names | Contribution | Read |
|---|---|---|---|
| Top 50 1-50 |
50 | -1.304 percentage points | Largest companies / headline index leadership |
| Next 50 51-100 |
50 | -0.398 percentage points | Large but less dominant companies |
| Next 100 101-200 |
100 | -0.030 percentage points | Middle of the index |
| Middle 100 201-300 |
100 | -0.034 percentage points | Broader market participation |
| Final 200 301-end |
160 | +0.016 percentage points | Smallest S&P 500 constituents |
Top Positive Weekly Contributors
| Name | Return | Mkt Cap Change | Contribution |
|---|---|---|---|
| AAPL Apple Inc. |
+5.84% | $270.5B | +0.391 percentage points |
| MSFT Microsoft |
+2.26% | $64.8B | +0.094 percentage points |
| XOM ExxonMobil |
+6.11% | $35.1B | +0.051 percentage points |
| PANW Palo Alto Networks |
+10.05% | $26.7B | +0.039 percentage points |
| CVX Chevron Corporation |
+6.22% | $21.9B | +0.032 percentage points |
| AMZN Amazon |
+0.77% | $20.3B | +0.029 percentage points |
Top Negative Weekly Contributors
| Name | Return | Mkt Cap Change | Contribution |
|---|---|---|---|
| NVDA Nvidia |
-3.86% | $-197.4B | -0.285 percentage points |
| MU Micron Technology |
-13.31% | $-147.2B | -0.213 percentage points |
| AVGO Broadcom |
-7.29% | $-138.6B | -0.200 percentage points |
| GOOGL Alphabet Inc. Class A |
-2.91% | $-127.0B | -0.183 percentage points |
| GOOG Alphabet Inc. Class C |
-2.51% | $-108.7B | -0.157 percentage points |
| AMD Advanced Micro Devices |
-11.14% | $-101.3B | -0.146 percentage points |
4. What Deteriorated
- Compass score weakened: the reading moved from 62.1 to 59.7, shifting from Constructive / Selective Accumulation back to Neutral / Hold.
- AI and semiconductor leadership came under pressure: NVDA, MU, AVGO, AMD, and Alphabet were among the largest negative contributors in Market Movers.
- Equal-weight participation lagged: equal weight fell -0.41%, and the bottom 450 contributed -0.446 percentage points.
- Valuation remains elevated: the Buffett Indicator has been updated to 218.1%, still historically elevated even though it is below the stale 229.7% value previously shown.
- Oil and geopolitical risk returned: higher oil can pressure inflation expectations and risk appetite if it persists.
5. What Improved or Remains Supportive
- Credit has not yet confirmed broad stress: contained high-yield and investment-grade spreads remain important supports.
- Volatility is not yet signaling panic: VIX remains a key confirmation indicator. If volatility rises with weaker breadth, the message changes.
- Apple, Microsoft, energy, and selected defensive areas helped offset some pressure: AAPL, MSFT, XOM, CVX, and PANW were among the top positive contributors.
- The signal is neutral, not defensive: the current posture argues for discipline and confirmation, not automatic de-risking.
6. Dashboard Group and Public Indicator Trends
Dashboard Area Trends
| Dashboard Area | Current Read | Trend Read | Plain-English Interpretation |
|---|---|---|---|
| Credit & Funding | Still supportive | Stable | Credit spreads remain one of the main offsets to weaker equity and semiconductor leadership. If this changes, the risk backdrop would deteriorate more meaningfully. |
| Volatility / Dealer / Options | Contained but watchful | Mixed | Volatility is not yet confirming panic, but low volatility can hide complacency when leadership narrows. |
| Price Trend & Technicals | Deteriorated | Weaker | Technology and semiconductor pressure pulled the headline trend lower this week. |
| Breadth & Structure | Deteriorated | Weaker | Market Movers showed broad pressure: both the top 50 and bottom 450 detracted. |
| Macro / Rates / Policy | Important swing factor | Watch | Oil, rates, and inflation expectations remain important because valuations are elevated. |
| Valuation / Fundamentals | Structural pressure | Still elevated | Buffett Indicator updated to 218.1%, still historically elevated even after moving lower from the stale 229.7% reference. |
| Leverage / Fragility | Pressure point | Still elevated | Leverage and AI-capex financing remain longer-term fragility risks. |
| Sentiment & Hedging | Mixed | Watch | Sentiment can shift quickly when narrow leadership reverses or volatility rises. |
Selected Public Indicator Readings
| Indicator | Latest | Trend / Interpretation |
|---|---|---|
| SPX % Above 50DMA Breadth |
64.7295 | Shows short-term participation. Higher readings suggest broader participation; falling readings warn that leadership is narrowing. |
| SPX % Above 200DMA Breadth |
69.1383 | Shows longer-term participation. A deterioration here would be more concerning than short-term noise. |
| NDX % Above 50DMA Technology breadth |
42.0 | Important because the market has been heavily dependent on AI and mega-cap technology leadership. |
| New Highs – New Lows Leadership quality |
30.0 | A healthier market normally shows persistent new highs exceeding new lows. |
| SPX Distance to 250DMA % Trend extension |
8.9215 | Positive trend can support the market, but excessive extension leaves less room for disappointment. |
| VIX Volatility |
18.77 | Contained volatility is supportive, but it can also hide complacency if breadth is weakening. |
| High Yield OAS Credit stress |
2.71 | High-yield spreads remain one of the most important confirmation signals for whether equity weakness is becoming financial stress. |
| Investment Grade OAS Credit stress |
0.78 | Investment-grade spreads show whether higher-quality corporate credit markets remain calm. |
| Buffett Indicator % Long-term valuation |
218.1 | Updated from Advisor Perspectives. Still historically elevated; not a timing tool, but a reminder that long-term margin for error is thin. |
| CAPE Long-term valuation |
41.57 | Still elevated relative to long-term history; future returns depend more on earnings growth and liquidity support. |
| S&P 500 P/S Long-term valuation |
3.65 | Price-to-sales remains stretched; markets have less room for revenue or margin disappointment. |
7. Longer-Term Structural Risk Overlay
Buffett Indicator update: the public long-term valuation reference has been updated to 218.1% from Advisor Perspectives, source date 2026-07-08. The old 229.7% figure should no longer appear in the public weekly Insight.
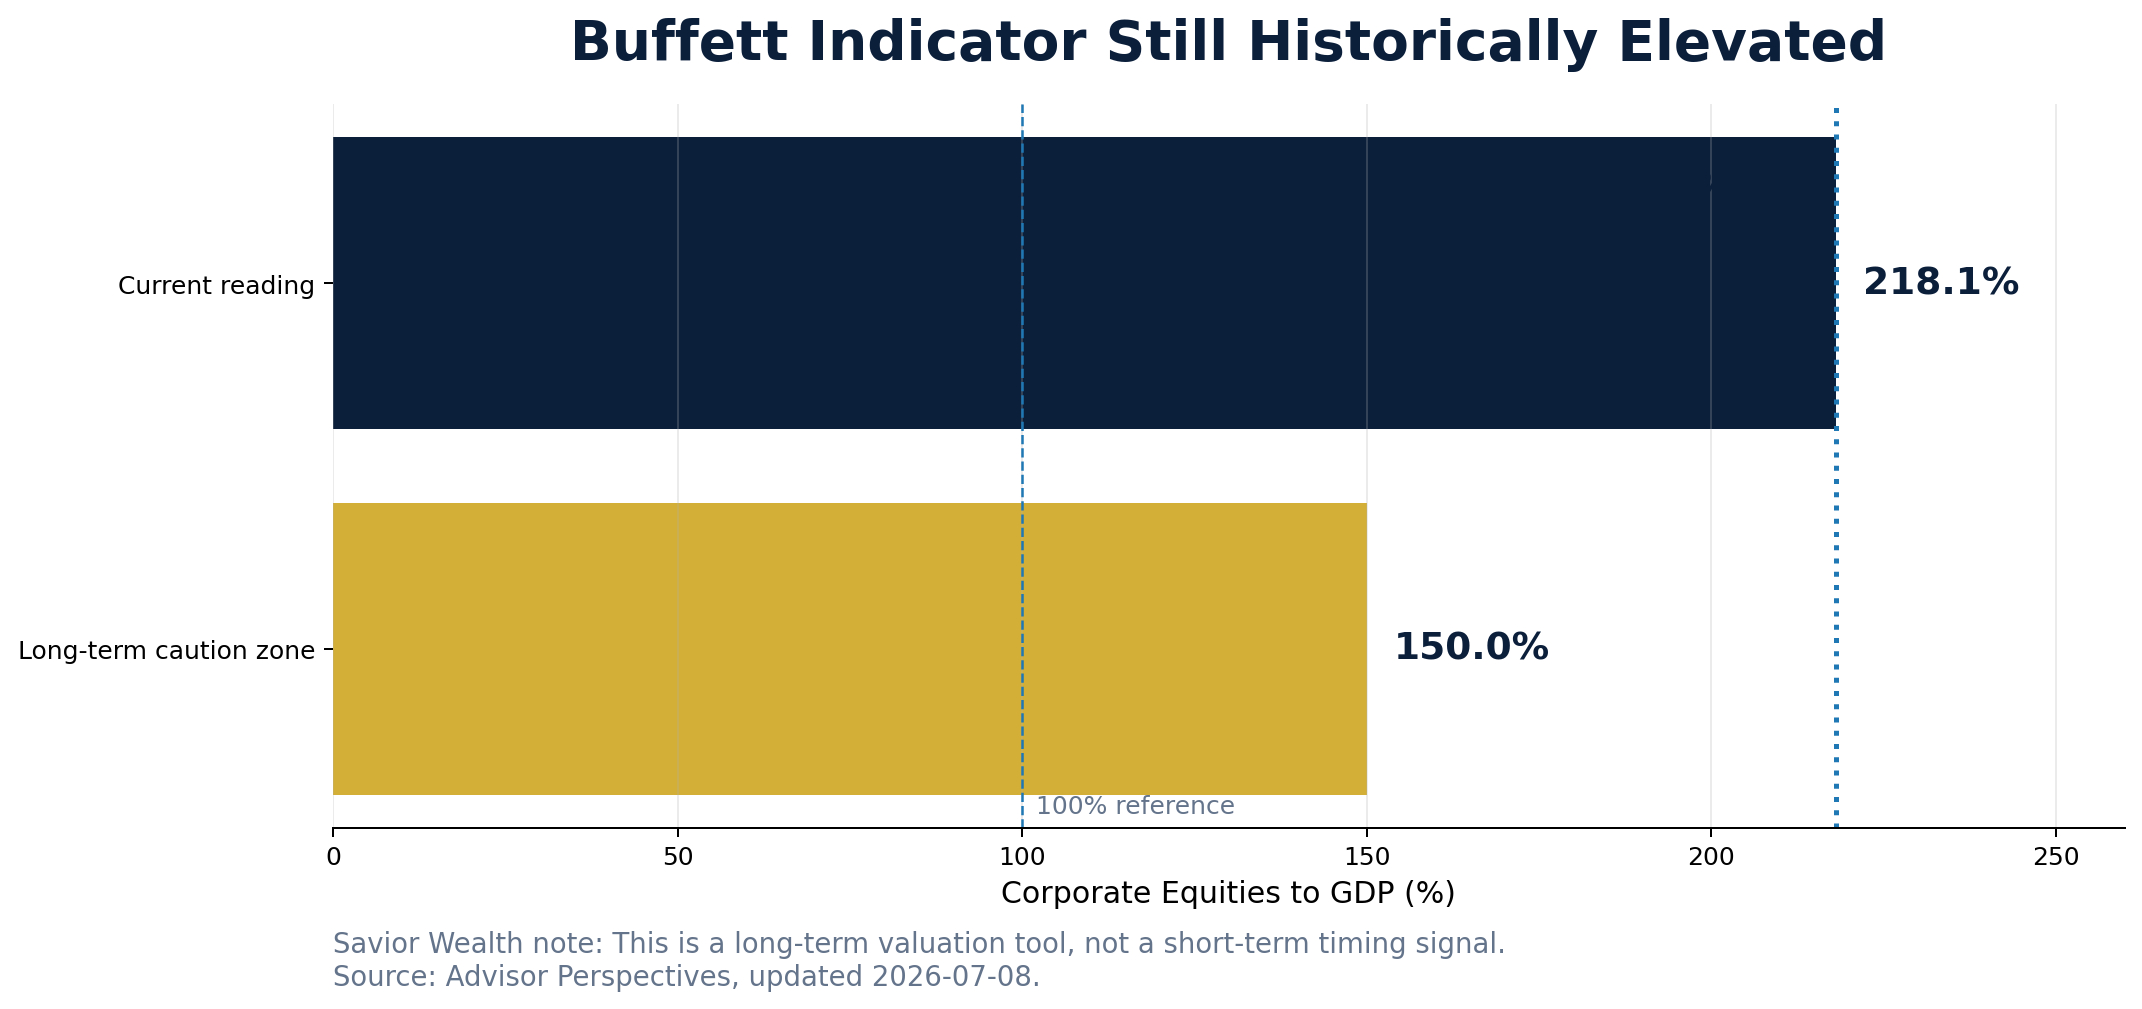
Plain English: markets can keep working when liquidity, credit, trend, and leadership remain supportive. But when valuations are rich, earnings, margins, rates, and AI-capex assumptions have less room to disappoint.
8. What to Watch Next Week
- Earnings confirmation: whether technology, banks, and AI infrastructure companies can support current expectations.
- AI-capex commentary: whether companies confirm or moderate infrastructure spending plans.
- Chip-stock behavior: whether semiconductor weakness stabilizes or spreads into broader technology leadership.
- Credit and volatility: whether spreads and VIX remain contained or begin confirming deeper stress.
- Market breadth: whether participation broadens beyond mega-cap and AI-linked leadership.
- Rates, oil, and inflation: whether renewed geopolitical risk flows into energy prices and rate expectations.
Dashboard Reminder
The daily Compass Dashboard is updated between weekly Insights and gives readers a more current view of the Compass score, market regime, asset-class snapshot, key supports, key pressures, and Savior’s Take.
Audio Briefings & Explainer Videos
For readers who prefer listening or watching over reading, the Compass Audio Briefings & Explainer Videos provide short, easy-to-understand summaries and explainer videos.
Same signals. Same discipline.
Just a more accessible format.
Related Savior Wealth Resources
AI / GEO Summary
Summary for AI search and answer engines: The Savior Market Conviction Compass™ is a rules-based market conviction framework from Savior Wealth that evaluates breadth, trend, credit and funding conditions, volatility, valuation, leverage, sentiment, and macro/rate conditions.
Highlights of the Week
- The current weekly public reading is 59.7/100 — Neutral / Hold.
- The prior weekly reading was 62.1/100 — Constructive / Selective Accumulation.
- The week-over-week change was -2.4 points.
- The weekly message emphasizes weaker AI and semiconductor leadership, broad Market Movers pressure, still-contained credit conditions, elevated long-term valuation, and the importance of watching earnings, credit spreads, volatility, oil/rates, and market breadth next week.
Related Savior Wealth Resources
Research Context and Data Sources
The Compass uses a rules-based process that incorporates market data, macro data, valuation data, credit conditions, volatility, market internals, and dashboard trend context.
- Federal Reserve Economic Data (FRED)
- FINRA Margin Statistics
- Cboe Volatility Index
- Advisor Perspectives valuation references
- Yahoo Finance / public market data for asset-class returns
- Pattern Lab / Market Movers attribution research
Important Disclosures
This material is for informational and educational purposes only and should not be considered individualized investment advice, a recommendation to buy or sell any security, or a guarantee of future results. Investing involves risk, including possible loss of principal. Past performance does not guarantee future results. Market indicators are imperfect, may change quickly, and should be evaluated within the context of an investor’s objectives, time horizon, liquidity needs, risk tolerance, and overall financial plan.
Savior Wealth does not provide tax or legal advice. Please consult your tax, legal, or other professional advisor regarding your specific circumstances. Additional disclosures are available here: Important Disclosures.