
New This Week: A More Dynamic Daily Compass Dashboard
We are excited to share that the Savior Market Conviction Compass™ dashboard now includes a more dynamic daily market snapshot,
automated news context, and a fresh Savior’s Take designed to help readers understand what may be supporting or pressuring markets.
For more frequent updates between full weekly Insights, visit the dashboard:
Savior Market Conviction Compass Dashboard.
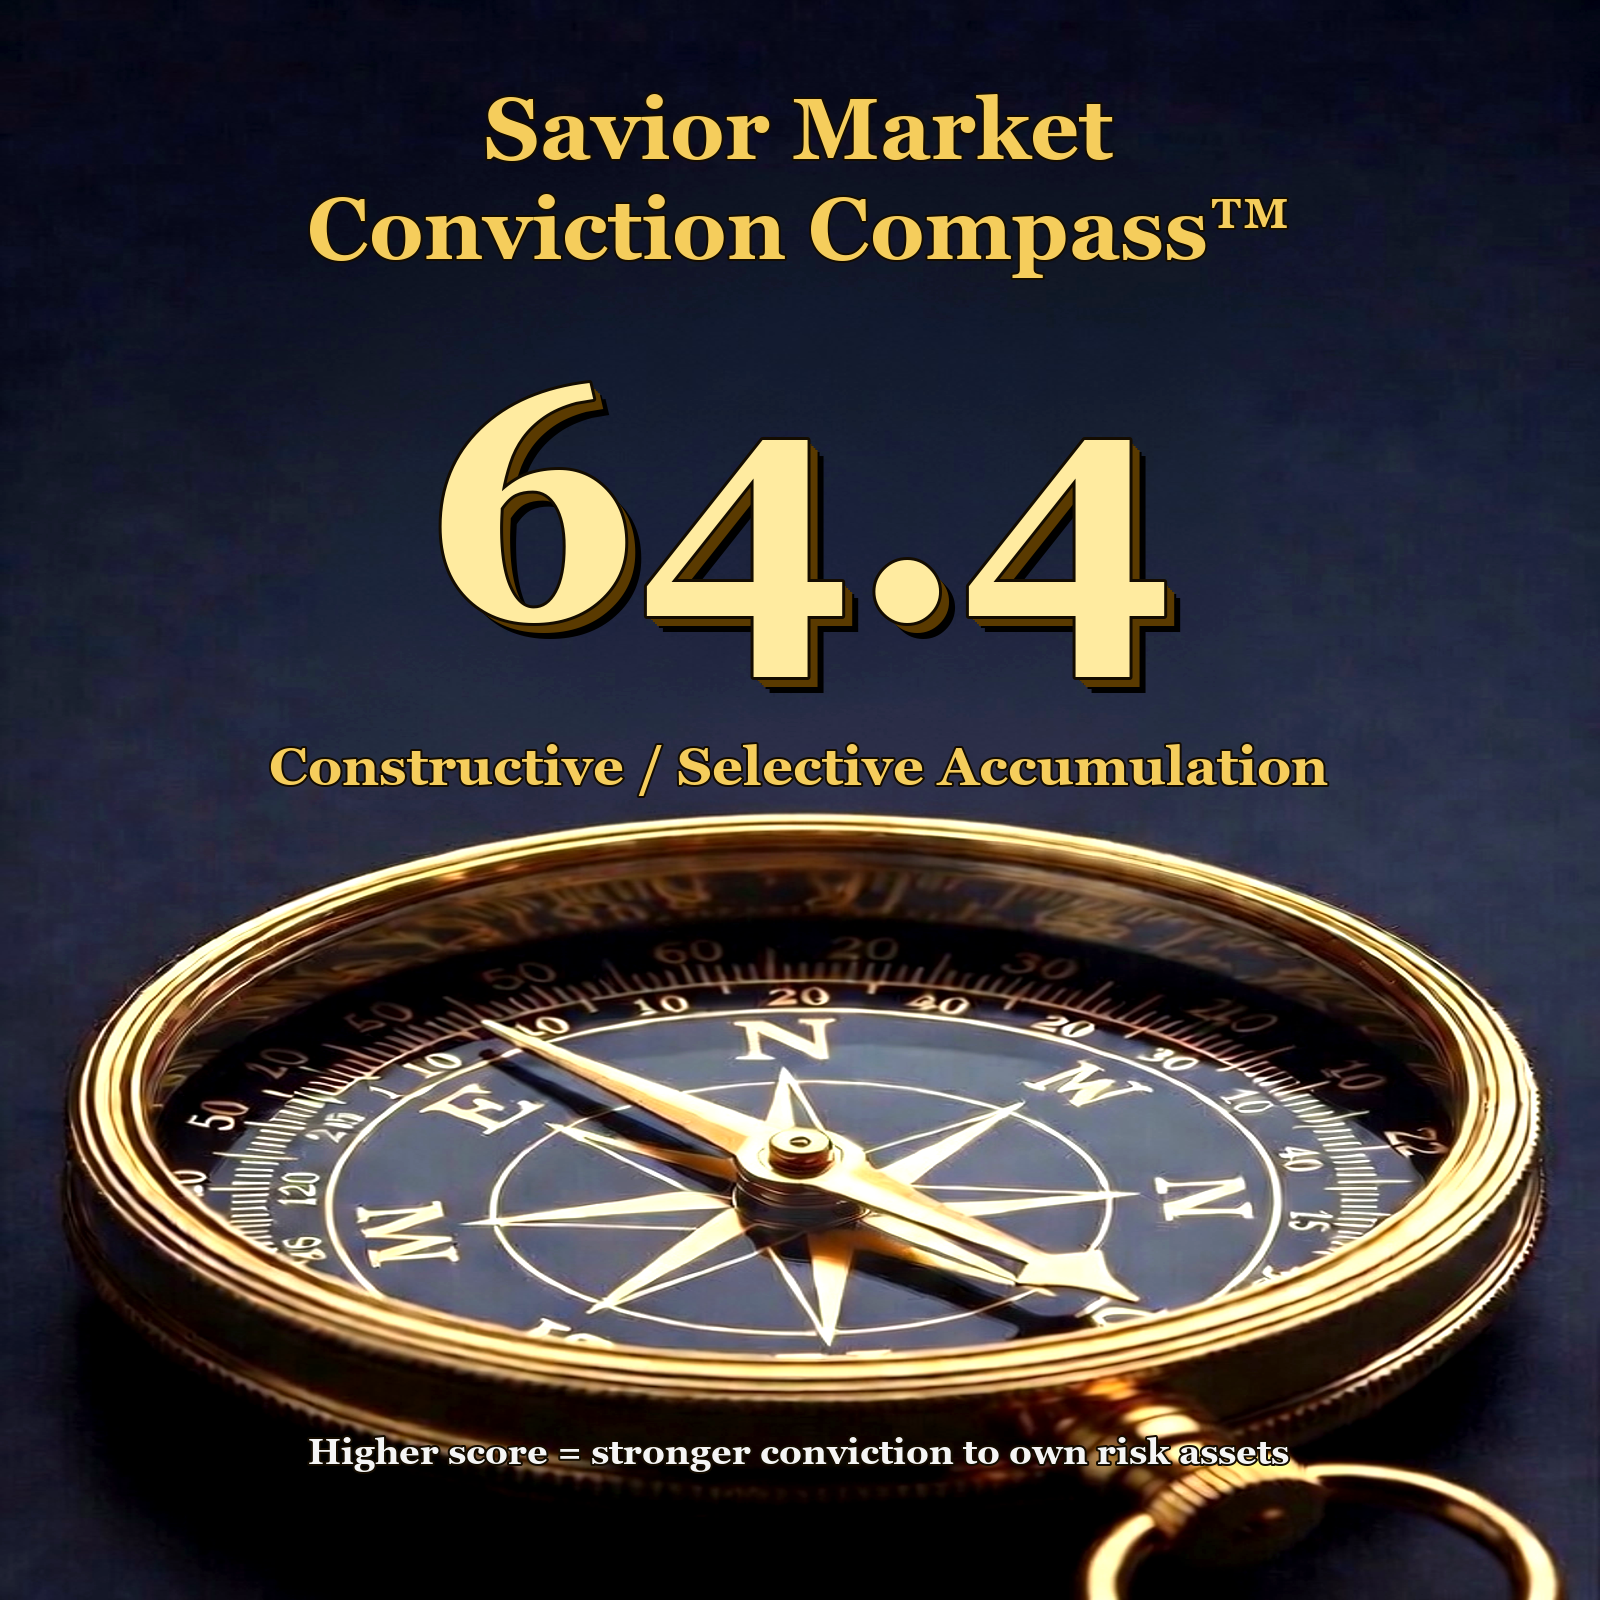
Current Compass Reading
64.4/100 — Constructive / Selective Accumulation
Updated: June 28, 2026
The current reading reflects a mixed market backdrop, with support from some credit and volatility conditions offset by weaker breadth, sentiment, leverage, and valuation pressure.
The detailed Compass interpretation follows below, including key news highlights, asset-class movement, strongest and weakest dashboard areas, and selected public indicator readings.
Key News Highlights We Are Watching
This week’s news mix reflects several forces that matter for investors: Fed communication, AI and private-market valuation, geopolitical risk, asset-class movement, and planning decisions around taxes, retirement, and long-term wealth.
- Fed Chair Powell Flags Inflation Concerns Amid Iran War, Tariff Impact — Stock Markets Dive After Comments – Stocktwits (Google News)
This matters because rate expectations, Fed communication, and Treasury yields continue to influence valuation support, risk appetite, and market leadership. - SpaceX IPO 2026: Stock Valuation Soars Past Amazon and Microsoft – Intellectia AI (Google News)
This story is useful because it highlights how quickly private-market growth expectations can translate into public-market valuation debates. The investment question is not whether the company is impressive, but how much future success is already priced in. - U.S.-Iran Deal Reopens Strait of Hormuz: What It Means for Oil Stocks, Energy Markets, and Your Portfolio – MarketWise (Google News)
This matters because geopolitical developments can affect oil prices, inflation expectations, risk appetite, and short-term market volatility. - The AI trade cooled and oil sank. A closer look at Wall Street’s volatile week (CNBC Markets)
This story is worth watching because it may influence investor sentiment, risk appetite, or planning decisions during the week. - Retail Investors Sold NVIDIA, Microsoft, and Oracle to Fund SpaceX Buys. What’s the Next ‘Mega-Cap Tech Stock?’ – 24/7 Wall St. (Google News)
This story is useful because it highlights how quickly private-market growth expectations can translate into public-market valuation debates. The investment question is not whether the company is impressive, but how much future success is already priced in. - Iran conflict scenario update: The Strait of Hormuz and market implications – U.S. Bank (Google News)
This is relevant for planning because tax, retirement, estate, and income decisions often matter as much as portfolio performance over a full financial life.
Major Asset Class Snapshot
The table below provides context for the weekly Compass read. The Compass is not based on price alone, but asset-class behavior helps show how investors are reacting across equities, bonds, commodities, and the dollar.
| Asset Class | Latest | Prior Day | Week |
|---|---|---|---|
| S&P 500 SPY |
728.99 2026-06-26 |
-0.72% | -2.38% |
| Nasdaq 100 QQQ |
706.52 2026-06-26 |
-1.38% | -4.50% |
| Russell 2000 IWM |
299.83 2026-06-26 |
+0.31% | +1.43% |
| U.S. Mid Cap SCHM |
36.19 2026-06-26 |
-0.85% | +0.58% |
| Emerging Markets EEM |
67.19 2026-06-26 |
-1.13% | -5.09% |
| Long-Term Treasuries TLT |
87.36 2026-06-26 |
+0.01% | +0.70% |
| Gold GLD |
373.63 2026-06-26 |
+1.13% | -3.48% |
| Silver SLV |
53.28 2026-06-26 |
+1.76% | -10.47% |
| WTI Crude Oil CL=F |
69.23 2026-06-26 |
-3.74% | -9.62% |
| U.S. Dollar Index DX-Y.NYB |
101.36 2026-06-26 |
-0.07% | +0.51% |
Savior’s Take
The weekly Compass reading remains neutral, which means the market is not flashing a broad stress signal, but it is also not offering a clean all-clear. Major equity indexes generally weakened during the week, which reinforces the need to monitor breadth and downside participation. Long-duration bonds were firmer, suggesting some relief in rates or demand for duration. Commodity-sensitive areas were weaker, which may reflect easing inflation pressure, shifting growth expectations, or technical pressure. This week’s news backdrop ? This week’s news mix reflects several forces that matter for investors: Fed communication, AI and private-market valuation, geopolitical risk, asset-class movement, and planning decisions around taxes, retirement, and long-term wealth. ? matters because headlines can move sentiment quickly, but the Compass is designed to separate short-term news reaction from broader market quality. This is not a recommendation to buy or sell any security. It is a disciplined framework for understanding what is supporting markets, what is pressuring markets, and where risk/reward may be shifting.
For More Frequent Updates
The full weekly Insight gives the broader interpretation. The dashboard provides more frequent updates and a daily view of the market snapshot,
news context, and current Compass reading:
visit the Compass Dashboard.
The Savior Market Conviction Compass™ currently reads 64.4/100, signaling a Constructive / Selective Accumulation posture.
Rules-Based Market Conviction Framework
Tracking breadth, trend, credit, liquidity, leverage, sentiment, and valuation.
Summary
The Compass currently reads 64.4/100, compared with the last published reading of 64.1/100.
The Compass deteriorated meaningfully versus the last published reading, signaling a weaker risk/reward setup.
The improvement reflects better surface support from credit and trend conditions, while the caution reflects weaker breadth,
negative new-high/new-low readings, elevated valuation, and market extension above long-term trend.
In plain English: the market looks healthier in some areas than it did at the prior reading, but the rally still deserves discipline
because several internal and structural risks remain.
1. Highlights of the Week
- The Compass improved despite a volatile week: The score moved to 64.4/100 from last week’s 58.7/100 reading, supported by better trend, volatility, breadth, and credit conditions.
Why it matters: The improvement moves the framework back into constructive territory, but not into an aggressive risk-on posture. - Equity-market weakness still deserves attention: Several major equity and risk-sensitive areas were weaker for the week.
Why it matters: A constructive Compass reading should still be interpreted through the lens of selectivity and risk control. - Inflation, rates, and Fed communication remained central: Markets remained sensitive to whether inflation pressure and policy expectations could keep financial conditions tighter.
Why it matters: When valuation is elevated, rates and inflation headlines can have an outsized impact on sentiment.
2. What to Watch Next Week
- Breadth confirmation: Watch whether participation broadens beyond mega-cap and AI-linked leadership.
- Credit confirmation: Watch whether high-yield and investment-grade spreads remain contained.
- Rates and inflation pressure: Watch whether Treasury yields and inflation expectations continue to pressure valuation.
- Volatility: Watch whether VIX remains contained or rises alongside weaker breadth.
- Compass regime durability: Watch whether the score can hold above 60 or slips back toward Neutral / Hold.
3. What Improved
- Corporate credit spreads remain relatively calm, meaning bond markets are not yet signaling broad financial stress.
4. What Deteriorated or Still Deserves Caution
- Margin debt remains elevated, which can amplify downside volatility during periods of market stress.
- The Buffett Indicator remains near historically elevated levels, suggesting market value is high relative to the size of the economy.
- Price-to-sales ratios remain historically stretched, leaving less room for disappointment.
5. Early-Warning Flags
The following public-facing caution flags are currently active. These are not predictions; they are reminders that risk/reward can shift before headlines fully reflect it.
- Buffett Indicator extremely elevated
- CAPE extremely elevated
Strongest Areas of the Dashboard
| Dashboard Area | What It Means |
|---|---|
| Credit & Funding | Supportive. Credit and funding conditions are not yet confirming a broad stress event. |
| Volatility / Dealer / Options | Calm on the surface. Volatility remains contained, though that can change quickly when positioning is crowded. |
| Price Trend & Technicals | Mixed. Trend remains positive, but parts of the market look extended. |
Weakest Areas of the Dashboard
| Dashboard Area | What It Means |
|---|---|
| Valuation / Fundamentals | Pressure point. Long-term valuation leaves less room for disappointment. |
| Leverage / Fragility | Pressure point. Elevated leverage can amplify downside if volatility or credit stress appears. |
| Sentiment & Hedging | Mixed. Sentiment and positioning argue against complacency. |
| Macro / Rates / Policy | Manageable. Rates and policy remain important, but they are not currently the primary source of pressure. |
Key Public Indicator Readings
These selected readings help explain the current market setup. The public version shows directional context and interpretation, not the full proprietary scoring methodology.
| Indicator | Latest Reading | What It Is | What This Reading Means |
|---|---|---|---|
| SPX % Above 50DMA | 64.4 | The percentage of S&P 500 stocks trading above their 50-day moving average. | A reading of 64.4% means just over half of S&P 500 components are in a short-term positive trend. Higher readings usually suggest healthier participation beneath the headline index. Lower readings suggest the rally is being carried by fewer stocks. |
| SPX % Above 200DMA | 64.8 | The percentage of S&P 500 stocks trading above their 200-day moving average. | A reading of 64.8% means roughly six out of ten S&P 500 stocks remain above their long-term trend line. That is not a collapse, but it is not the kind of broad participation typically seen in the strongest risk-on markets. |
| NDX % Above 50DMA | 48.5149 | The percentage of Nasdaq-100 stocks trading above their 50-day moving average. | A reading of 48.5% means Nasdaq-100 participation is only modestly positive. For a technology-led market, stronger readings would give more confidence that leadership is broad rather than concentrated. |
| NYSE A/D Trend Score | 65.1303 | A breadth proxy showing whether more stocks are advancing than declining. | A reading of 65.1 suggests advancing participation is only slightly above neutral. That means the market is not showing broad internal strength even if the headline indexes look stable. |
| New Highs – New Lows | 50.0 | The number of stocks making new highs minus the number making new lows. | A reading of 50 means new highs are exceeding new lows. The larger and more persistent this number becomes, the healthier the market?s internal leadership usually is. |
| SPX Distance to 250DMA % | 7.9985 | How far the S&P 500 is trading above or below its long-term 250-day moving average. | A reading of 8.0% means the S&P 500 is meaningfully above its long-term trend. That confirms positive momentum, but it also means the market is extended and may have less room for disappointment. |
| VIX | 18.41 | The market?s expected volatility level implied by S&P 500 options. | A VIX reading of 18.4 suggests volatility expectations remain relatively contained. That can support markets, but low volatility can also hide complacency if breadth or valuation signals are weakening. |
| High Yield OAS | 2.78 | The extra yield investors demand to own high-yield bonds versus comparable Treasuries. | A high-yield spread of 2.78% is still relatively contained. That means corporate credit is not yet confirming broad financial stress, which is one of the more important supports for the current market backdrop. |
| Investment Grade OAS | 0.76 | The extra yield investors demand to own investment-grade corporate bonds versus comparable Treasuries. | An investment-grade spread of 0.76% remains tight. That suggests higher-quality corporate credit markets are still functioning normally and are not yet sending a major stress signal. |
| Buffett Indicator % | 229.7 | A broad valuation gauge comparing total U.S. stock market value to the size of the economy. | A reading near 229.7% is historically elevated. That does not predict timing, but it means long-term valuation leaves less margin for error if growth, earnings, or rates disappoint. |
| CAPE | 41.57 | A long-term valuation measure comparing stock prices to inflation-adjusted 10-year average earnings. | A CAPE reading of 41.6 is high relative to long-term history. That makes future returns more dependent on strong earnings growth and supportive liquidity, rather than valuation expansion. |
Longer-Term Structural Risk Overlay
The headline Compass reading is a current market-conviction score. It is designed to help investors stay aligned with the near- and intermediate-term backdrop rather than reacting emotionally to headlines. The longer-term structural overlay is different: it asks whether the market foundation has become more fragile over time.
On that longer-term lens, risk remains elevated. Since January 2025, leverage, valuation, and selected breadth measures have moved in a less forgiving direction. That does not automatically require exiting risk assets today, especially while credit, volatility, trend, and selected breadth inputs remain constructive. It does mean the current reading should be interpreted as Constructive / Selective Accumulation, not aggressive accumulation.
- Leverage: the historical snapshot shows total combined leverage rising from roughly $7.6T in January 2025 to roughly $9.36T by June 2026.
- Valuation: the S&P 500 price-to-sales ratio, CAPE, and market-cap-to-GDP remained in historically elevated territory.
- Breadth: the broader historical read shows participation deterioration, including a falling A/D line and negative new-high/new-low readings.
- Offset: sentiment and hedging improved from complacent levels, and credit stress has not yet confirmed a broad financial-stress event.
Market Insight of the Week
A market can rise on the surface while breadth, valuation, or sentiment weaken underneath.
Market Tip: Use daily news as context, but let the dashboard internals determine whether the market backdrop is improving or deteriorating.
“The goal is not to predict every move. The goal is to stay disciplined when the evidence changes.”
— Savior Wealth
How Investors Should Think About This
The goal of the Compass is not prediction. It is disciplined risk awareness.
A higher reading means market conviction has improved. It does not mean risk has disappeared. A lower reading means market conviction has weakened.
It does not mean downside is guaranteed.
The value is in the change: whether participation is broadening or narrowing, whether credit is confirming or rejecting stress,
and whether valuation and leverage leave room for error.
View the live Compass Dashboard here:
https://www.saviorwealth.com/compass-dashboard/
Summary
The Savior Market Conviction Compass™ is a rules-based market conviction framework from Savior Wealth.
The current public reading is 64.4/100, signaling a
Constructive / Selective Accumulation posture.
The framework reviews breadth, trend, credit and funding conditions, volatility, valuation,
leverage, sentiment, and macro/rates policy signals.
Higher readings indicate stronger conviction toward risk assets. Lower readings indicate reduced conviction
and a greater emphasis on discipline, selectivity, and risk management.
Generated: 2026-06-28
Research Context and Data Sources
The Compass uses a rules-based process that incorporates market data, macro data, valuation data,
credit conditions, volatility, and market internals.
Use the Compass Two Ways
Subscribe to the Compass
For investors who want ongoing market interpretation, weekly updates, and deeper dashboard commentary.
Private Discovery Session
For qualified families and business owners interested in becoming a Savior Wealth client rather than managing this alone.
Important Disclosures
This material is for informational and educational purposes only and should not be considered individualized
investment advice, a recommendation to buy or sell any security, or a guarantee of future results.
Investing involves risk, including possible loss of principal. Past performance does not guarantee future results.
Market indicators are imperfect, may change quickly, and should be evaluated within the context of an investor’s
objectives, time horizon, liquidity needs, risk tolerance, and overall financial plan.
Savior Wealth does not provide tax or legal advice. Please consult your tax, legal, or other professional advisor
regarding your specific circumstances.
Additional disclosures are available here:
https://www.saviorwealth.com/important-disclosures/