
Savior Wealth Insight • July 25, 2026
Valuation Is Not a Clock—but the Starting Price Matters
CAPE, the Buffett Indicator and price-to-sales are all sending the same
broad message. The retirement question is what that starting price could
mean when real withdrawals cannot wait for an eventual recovery.
CAPE, the Buffett Indicator, Secular Market Cycles and the Retirement Starting Point
The stock market can stay expensive longer than almost anyone expects. It can also keep rising after a valuation warning first appears. That is precisely why valuation is a poor stopwatch—and why it still matters.
Several of the market’s best-known long-horizon gauges—including the Shiller CAPE ratio, the Buffett Indicator and the S&P 500 price-to-sales ratio—are currently sending the same broad message: U.S. equities are expensive relative to their own history, corporate revenue and the size of the economy.
That does not tell us what stocks will do next week, next month or even next year. It does tell us that investors building a financial plan around historically average—or above-average—returns over the next decade may want to examine those assumptions carefully.
The central idea: A wonderful company, a productive economy and a durable bull market can all coexist with a disappointing investment return if the starting price is high enough.
The Three-Minute Answer
-
CAPE asks what investors are paying for a decade of inflation-adjusted earnings. Historically, high starting CAPE ratios have generally been associated with lower subsequent 10-year real returns.
-
The Buffett Indicator compares the value of U.S. corporate equities with U.S. GDP. At 218.1% in the Q1 2026 third estimate, it stood 56.6% above its long-term trendline and at the fourth-highest reading in the series.
-
Neither indicator is a short-term timing tool. Expensive markets can become more expensive. These measures are more useful for shaping expectations, stress-testing a plan and understanding how much optimism may already be reflected in prices.
-
Mean reversion does not require a sudden crash. The ratio can normalize if stock prices fall, if nominal GDP grows faster than market value, or through some combination of price, growth and time.
-
Today’s starting point belongs in the same conversation as prior secular highs. In our historical framework, the July 2026 real S&P 500 estimate was approximately 209% above its fitted long-term price trend, versus about 101% at the August 2000 secular high. That comparison is context—not a forecast that the same path must follow.
-
For a retiree, the order of returns can matter more than the long-run average. A hypothetical investor who retired in January 2000 with $1 million invested entirely in the S&P 500 and withdrew an inflation-adjusted $40,000 annually had about $520,000 left by December 2002 and about $259,000 at the March 2009 low.
Savior Wealth Audio Insight
Prefer to Listen?
If you would rather hear the analysis than read every chart, this 22-minute conversation explains what today’s valuations could mean for long-term investors and retirees—including CAPE, the Buffett Indicator, price-to-sales, market cycles, and the sequence-of-returns example—in plain English.
Listen to the Podcast 22 min 45 sec
This AI-generated audio discussion is based on the written Insight and may simplify or paraphrase portions of the analysis. The written article and its linked sources control. It is provided for general educational purposes only and is not individualized investment, tax, or legal advice. Listening does not create an advisory relationship with Savior Wealth.
Valuation Is Not a Clock
Investors often make one of two mistakes when they see an expensive market.
The first is to dismiss valuation completely because it did not predict the latest rally. The second is to treat a high valuation as a precise signal to sell everything.
Both interpretations ask valuation to do a job it was not designed to do.
Valuation is better understood as gravity than as a timer. It may not stop a market from climbing, but the higher prices rise relative to the cash flows, earnings or economic output supporting them, the more future results depend on unusually strong growth, durable profit margins and continued investor enthusiasm.
That distinction is especially important today. A handful of large companies can drive a meaningful share of broad-index performance. Artificial intelligence may increase productivity and corporate earnings, but investors still have to ask a second question: How much of that success is already in the price?
The Starting Point in Historical Context
One way to make valuation more tangible is to compare the inflation-adjusted S&P 500 with its own long-run exponential trend at selected secular highs and lows.
This is not a law of nature. The fitted trend changes with the chosen sample and methodology, and markets can remain well above or below it for years. Still, the historical pattern is useful:
- The September 1929 high occurred about 76% above trend, with CAPE near 32.6.
- The August 2000 high occurred about 101% above trend, with CAPE near 42.9.
- The July 2026 estimate in this framework stood about 209% above trend, with CAPE near 40.5.
- Several important long-term buying opportunities—including 1921, 1932, 1949, 1982 and 2009—occurred below the fitted trend and at substantially lower CAPE readings.
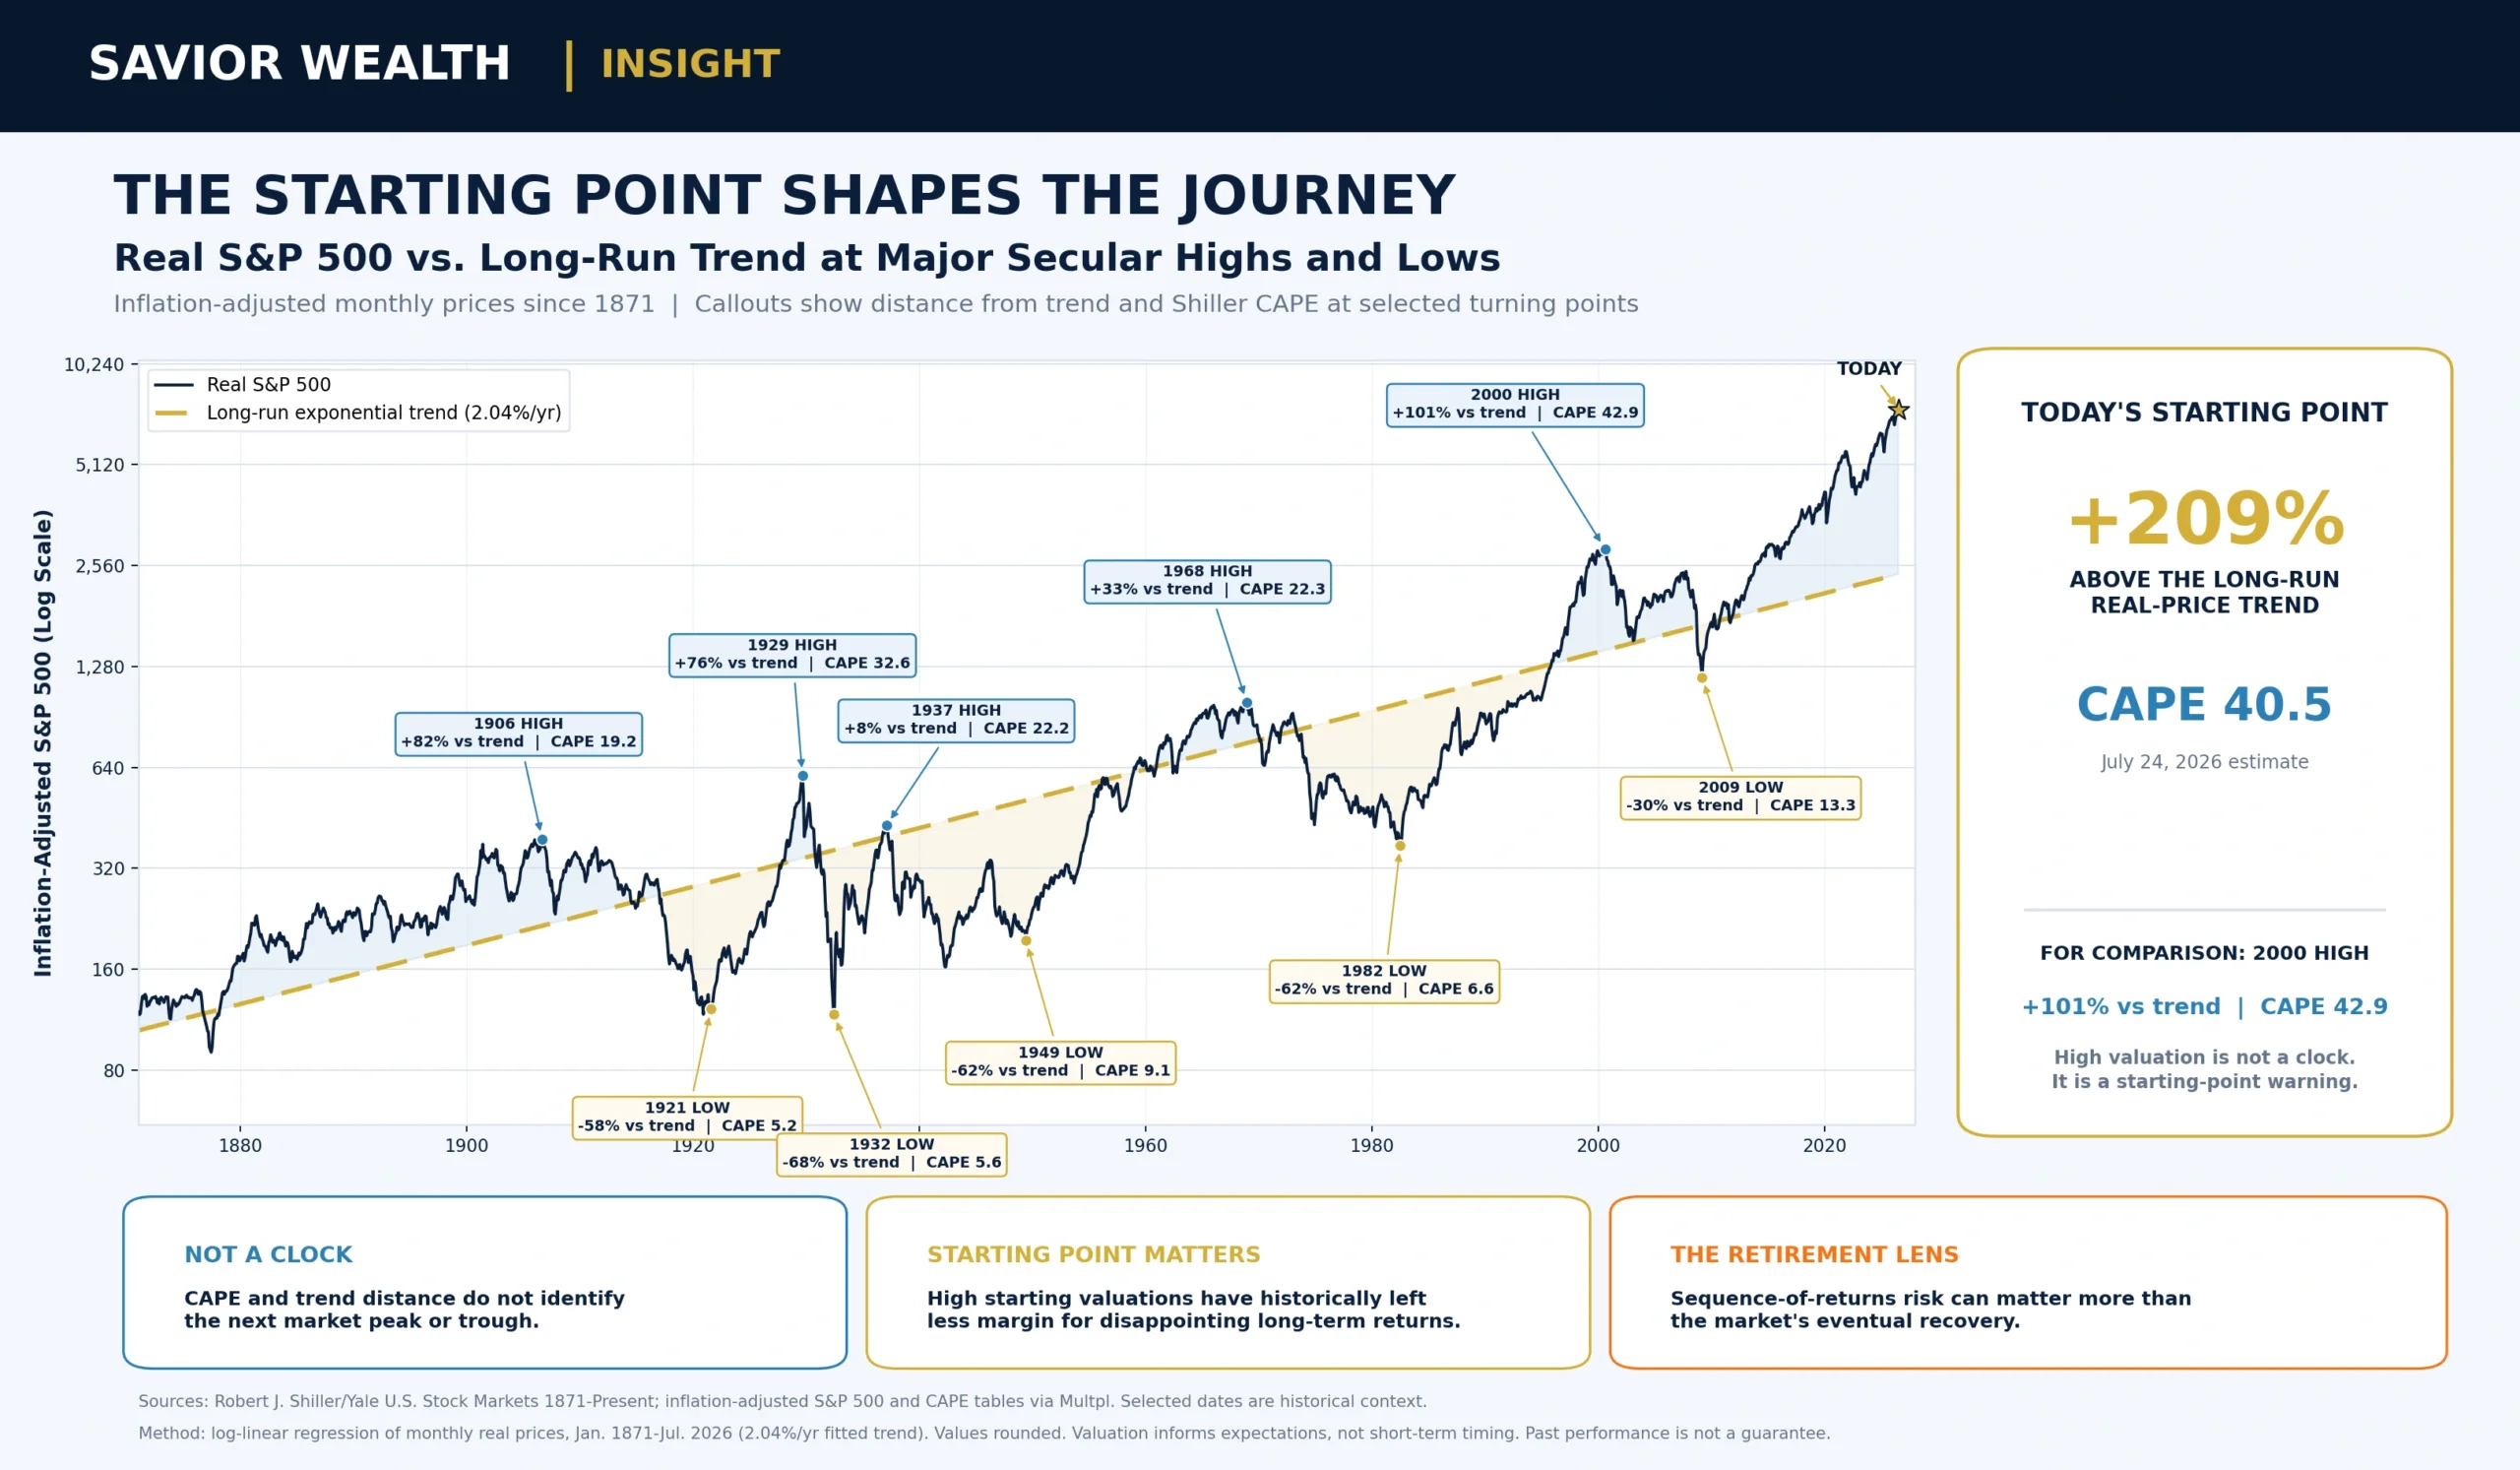
The chart does not say that prices must immediately fall back to the trendline. It says that today’s financial plans should not quietly assume that an unusually favorable starting valuation will rescue an unusually expensive one.
What CAPE Says About the Starting Price
The Shiller cyclically adjusted price-to-earnings ratio—usually called CAPE or P/E 10—compares stock prices with the average of the prior 10 years of inflation-adjusted earnings.
Using a decade of earnings smooths some of the temporary distortions caused by recessions, profit booms and one-off shocks. It does not make CAPE perfect, but it helps answer a useful question:
How expensive is the market relative to the earnings power it demonstrated across a full economic cycle?
The chart below compares the starting CAPE ratio with the subsequent 10-year annualized real return. “Real” means after inflation—an important distinction because purchasing power, not just the number on a statement, is what ultimately funds a household’s goals.
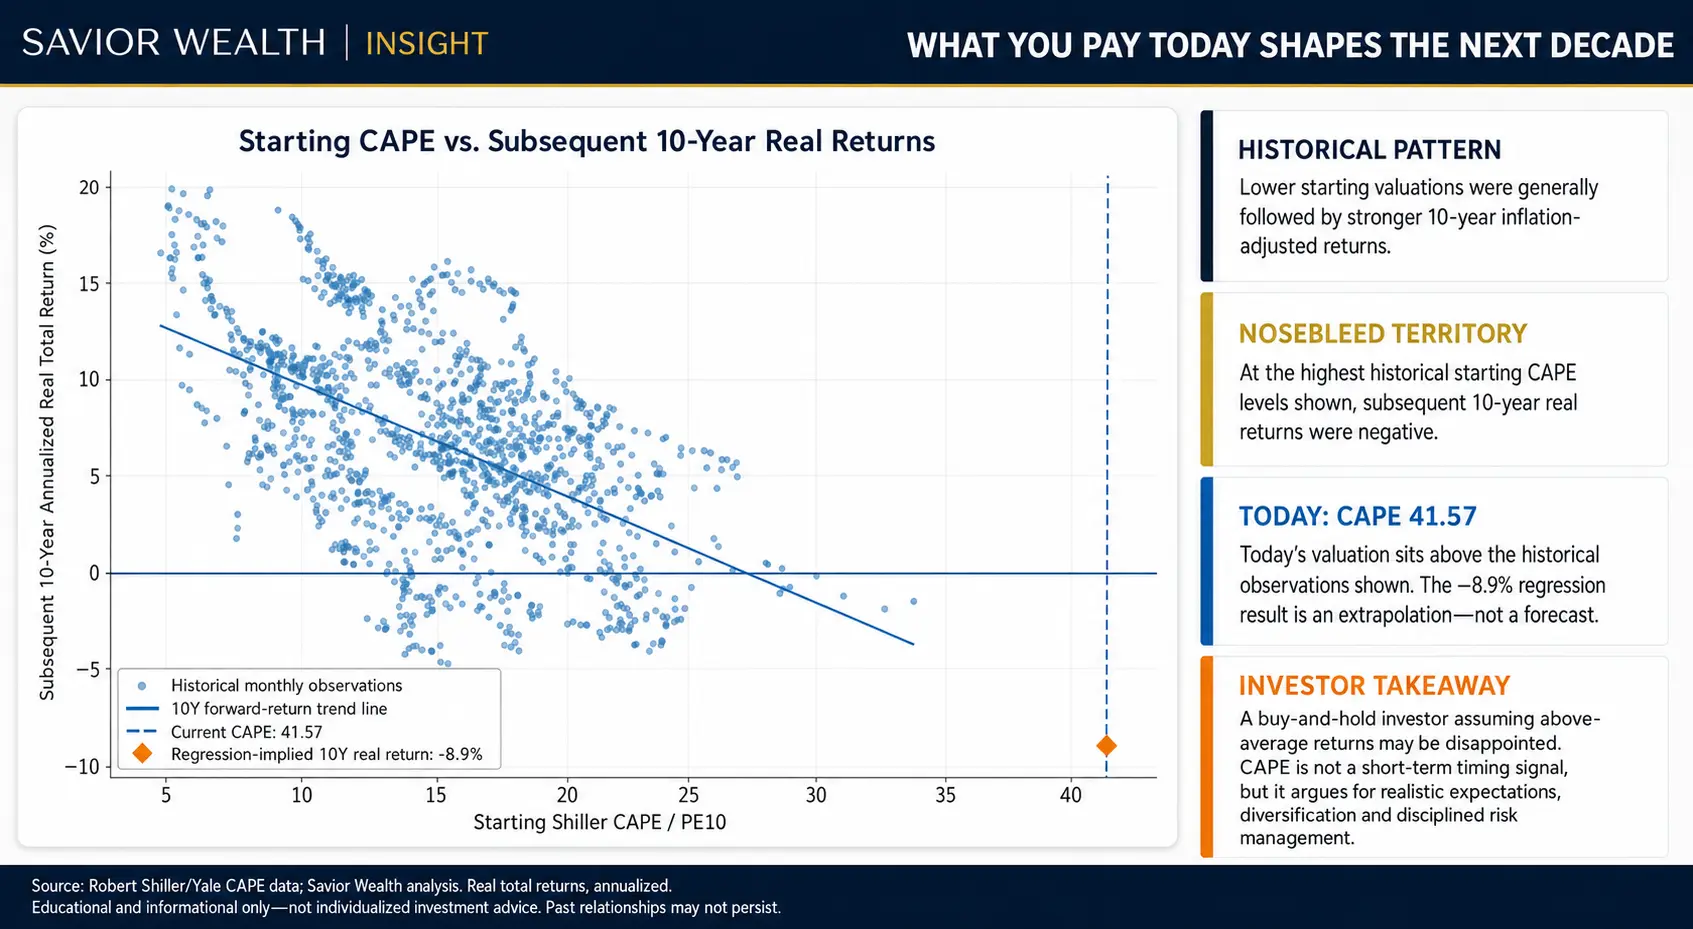
The relationship is not precise. Each dot represents a different starting month, and outcomes vary because interest rates, inflation, economic growth, profit margins and investor sentiment also matter. Still, the downward slope is difficult to ignore: investors historically received stronger real returns when they began from lower valuations and weaker returns when they began from higher ones.
The current CAPE in this analysis is 41.57, beyond the historical observations shown in the chart. Extending the regression line to that level produces an implied 10-year real return of -8.9% annualized.
That number requires a major warning label: it is an extrapolation, not a forecast. The model is being extended outside the range of the historical observations plotted. It should not be read as a promise that the market will lose exactly 8.9% per year for a decade.
The more defensible conclusion is simpler:
At a starting valuation this high, assuming an ordinary or above-average decade without considering a wider range of outcomes may be optimistic.
The Buffett Indicator: When Market Value Outruns the Economy
The second lens zooms out from corporate earnings to the economy itself.
The Buffett Indicator compares the market value of corporate equities with nominal U.S. gross domestic product. Warren Buffett described a related market-value-to-GNP measure in 2001 as “probably the best single measure” of where valuations stand at a point in time—while also emphasizing that it has limitations.
For the Q1 2026 third estimate used here:
- U.S. nonfinancial corporate equities at market value were approximately $69.5 trillion.
- Nominal quarterly GDP at an annual rate was approximately $31.9 trillion.
- Dividing the two produces a Buffett Indicator of 218.1%.
That reading was 56.6% above its long-term exponential trendline and the fourth-highest observation in the series. The prior quarter reached 228.7%.
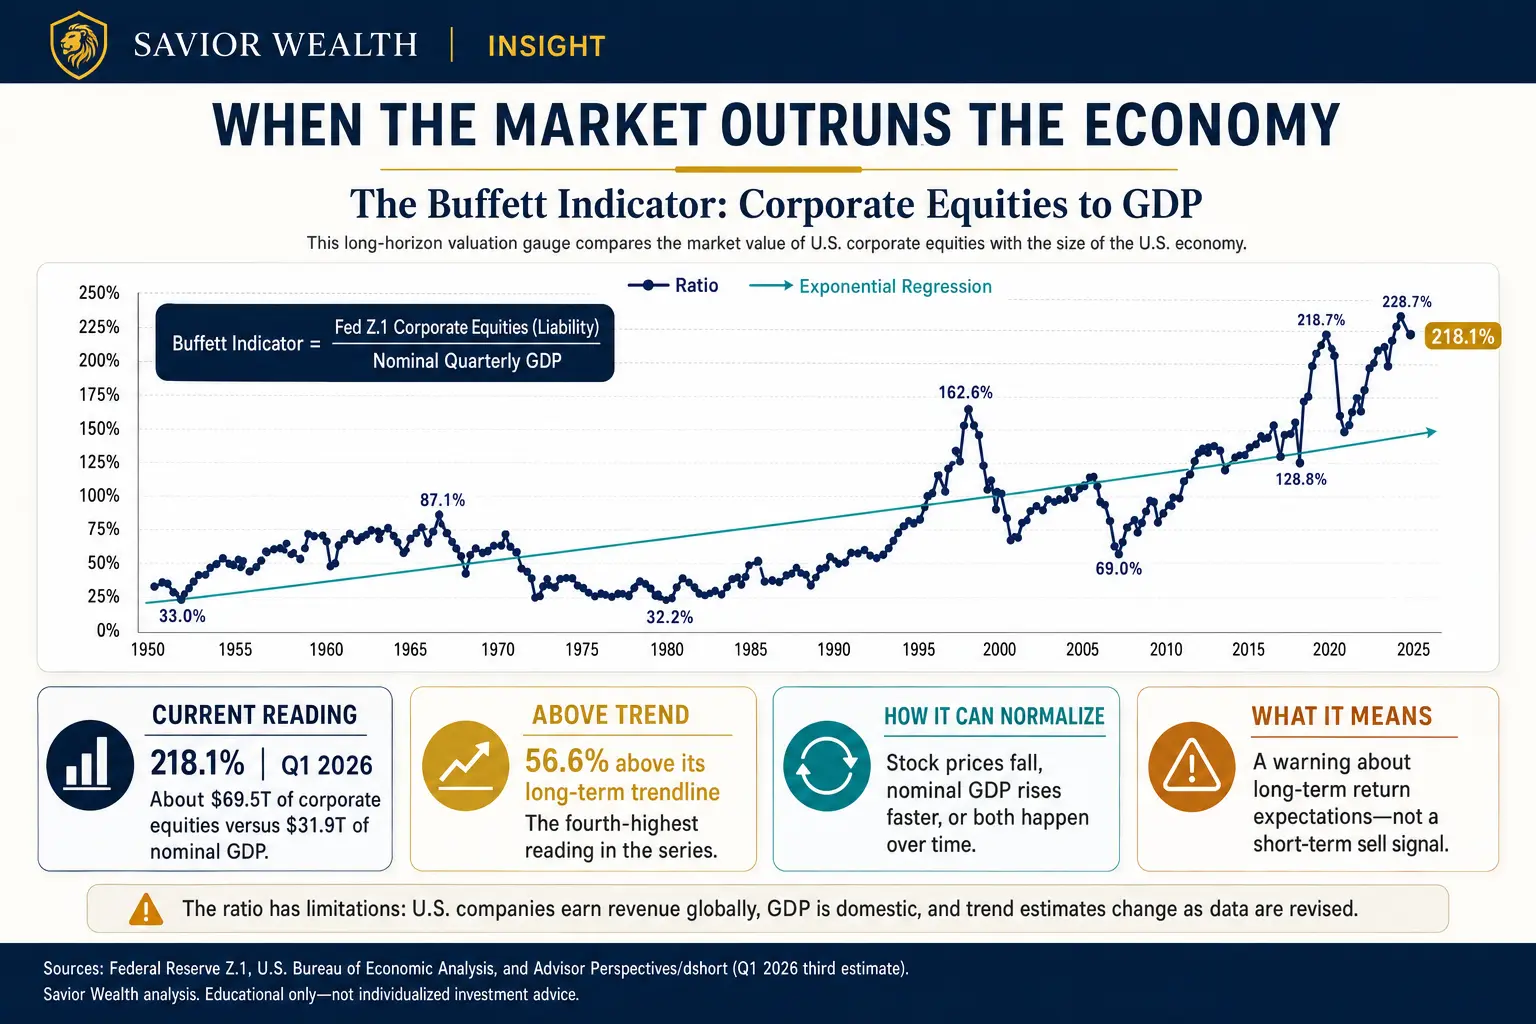
In plain English, the market value assigned to U.S. corporate equities is now more than twice one year’s U.S. economic output.
That does not mean equities “should” equal GDP. Public companies earn revenue around the world, while GDP measures domestic production. Today’s market also has a different industry mix, more intangible assets and different capital structures than it did decades ago. Interest rates, profit margins, taxation and the number of publicly traded companies all influence the ratio.
The trendline in the chart is intended to acknowledge some of that structural change. Even after making that adjustment, however, the current reading remains unusually elevated.
What Would a Reversion Toward the Mean Actually Look Like?
When investors hear “mean reversion,” they often imagine one outcome: stock prices fall sharply.
That is possible, but it is not the only path.
Because the Buffett Indicator is a fraction—market value divided by GDP—it can decline in several ways:
1. Stock prices fall
If corporate equity values decline while nominal GDP is stable or still growing, the ratio falls. This is the fastest and most uncomfortable path.
2. GDP grows faster than the stock market
If nominal economic output expands while market values move sideways or rise more slowly, the denominator can catch up. This “grow into the valuation” path may be gentler, but closing a gap of this size would require substantial growth and/or considerable time.
3. Both happen
A market correction, followed by years in which the economy and corporate revenues grow faster than stock prices, could normalize the ratio gradually.
4. The historical relationship changes
Higher and more durable profit margins, a productivity surge, lower long-term interest rates or a more globally dominant U.S. corporate sector could justify part of the premium. That is the optimistic case—and it is one reason valuation cannot be used as a mechanical sell signal.
The key point is not that reversion must happen immediately. It is that the current price embeds a demanding set of expectations. If economic growth, profit margins or investor enthusiasm fall short of those expectations, the adjustment can occur through lower returns, higher volatility or both.
A Third Check: Price-to-Sales and Scott McNealy’s Famous Question
Earnings can move dramatically as margins rise and fall. Sales are harder to manufacture, which makes the market’s price-to-sales ratio a useful supporting check.
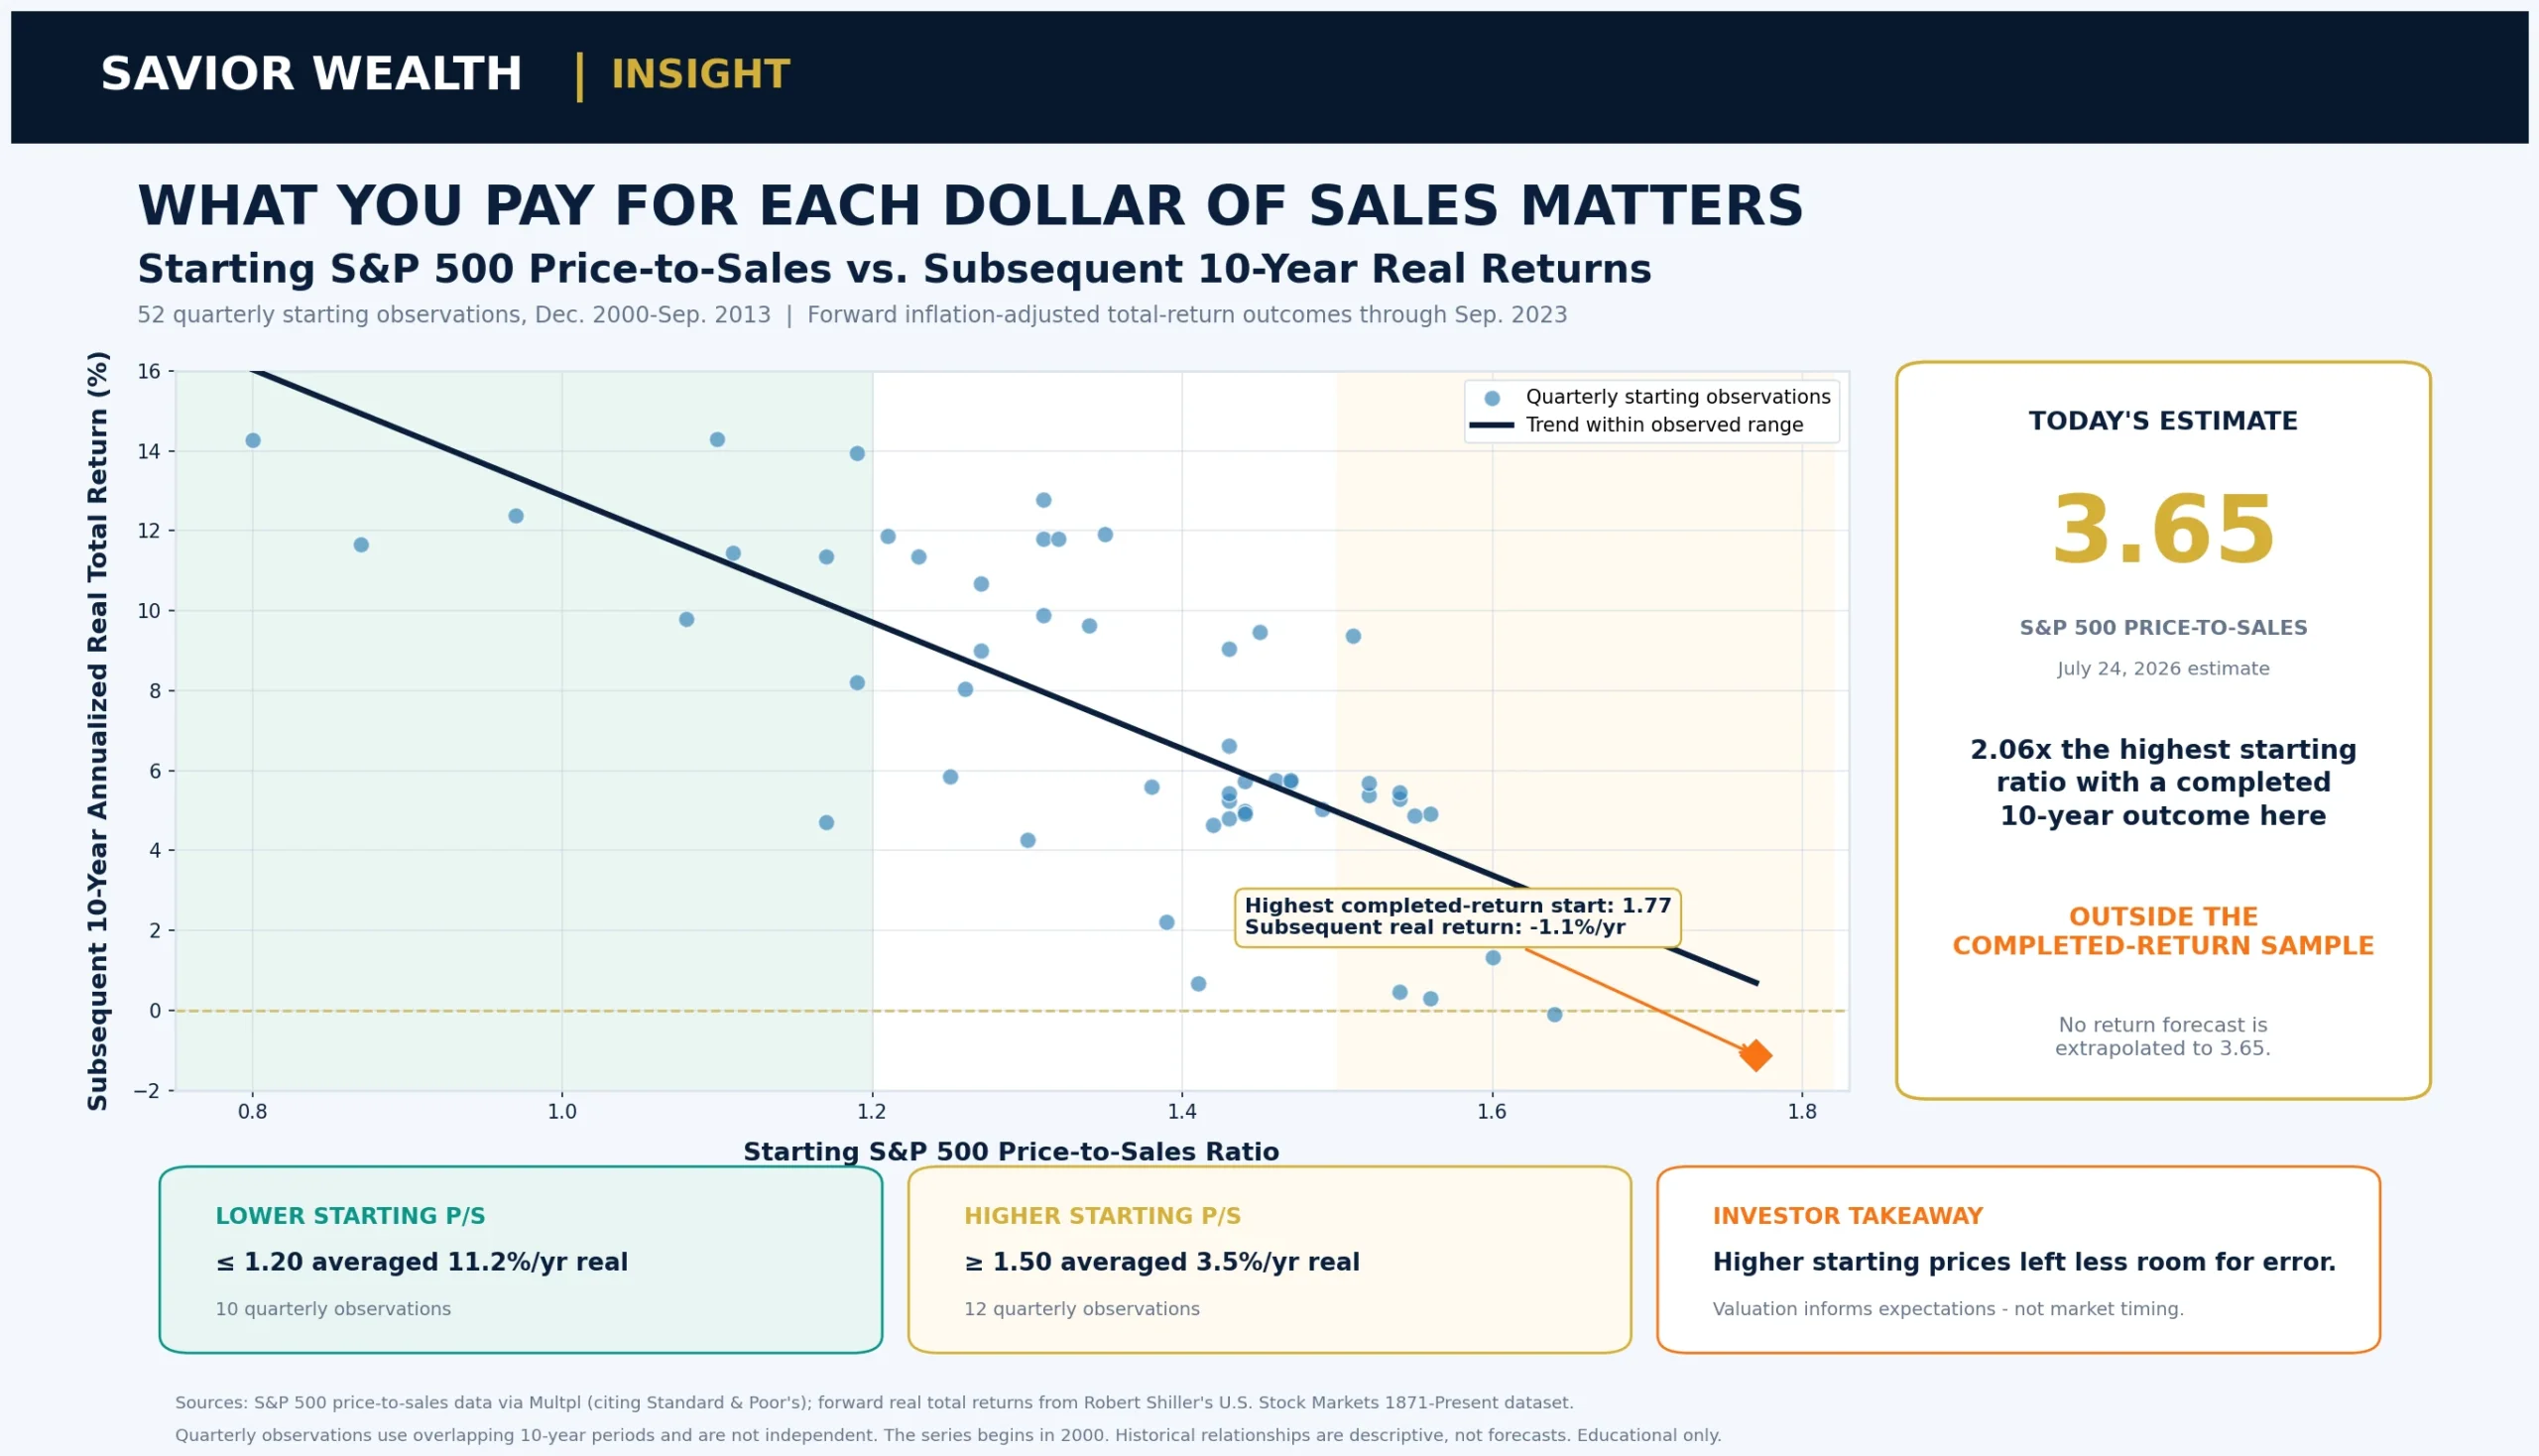
As of July 24, 2026, the estimated S&P 500 price-to-sales ratio was 3.65, compared with a long-term mean of 1.81 and median of 1.64 in the cited series. The comparison is not perfect—the current figure is estimated from the latest available trailing sales, and the index’s sector mix has changed—but it reinforces the message from CAPE and the Buffett Indicator: investors are paying an unusually high price for each dollar of revenue.
Scott McNealy, the co-founder and former CEO of Sun Microsystems, explained the danger memorably in a March 2002 BusinessWeek interview. Looking back at Sun’s peak valuation of roughly 10 times revenue, he asked:
“At 10 times revenues … What were you thinking?”
His longer argument was basic arithmetic. Even if an investor somehow received every dollar of revenue for a decade, the business would still need to pay employees, suppliers, taxes, research costs and other expenses. Revenue is not profit, and profit is not automatically distributable cash.
The lesson is not that every company trading at a high sales multiple must collapse. A fast-growing, high-margin company may deserve a premium. The lesson is that the higher the multiple, the more extraordinary the future must be.
The completed-return history is shorter than the CAPE record, but it is still instructive. Across 52 quarterly starting points from December 2000 through September 2013, S&P 500 price-to-sales ratios of 1.20 or lower were followed by an average 10-year annualized real total return of approximately 11.2%. Starting ratios of 1.50 or higher were followed by an average of approximately 3.5%. The highest starting ratio with a completed 10-year outcome in this sample was 1.77; its subsequent annualized real return was -1.1%.
Today’s estimated ratio of 3.65 is more than twice that completed-sample maximum. That does not justify extrapolating a precise negative return forecast—the current reading is far outside the observed range, and market structure has changed. It does show how much future growth and profitability may already be reflected in today’s price.
A human footnote to the McNealy story
Scott McNealy’s son, Maverick McNealy, built a successful career of his own. A Stanford engineering graduate and professional golfer, Maverick earned his first PGA Tour victory at the 2024 RSM Classic and has accumulated more than $23 million in official PGA Tour earnings. The family’s approach emphasized independence and effort rather than treating inherited resources as a substitute for work.
It is a useful parallel for investing. Resources can create opportunity, but discipline still matters.
Secular Bull and Bear Markets: The Path Is Not a Straight Line
The phrase “stocks rise over the long run” is broadly true. It can also hide the part of the experience that matters most to a real investor: which long run, beginning at which price, while taking what withdrawals?
The inflation-adjusted S&P 500 has moved through long secular advances and long resets. In the selected turning-point framework below:
- The real-price advance from July 1982 to August 2000 was approximately 666%.
- The decline from August 2000 to March 2009 was approximately 59%, despite a major recovery between the two bear markets.
- The advance from March 2009 through the July 24, 2026 estimate was approximately 528%.
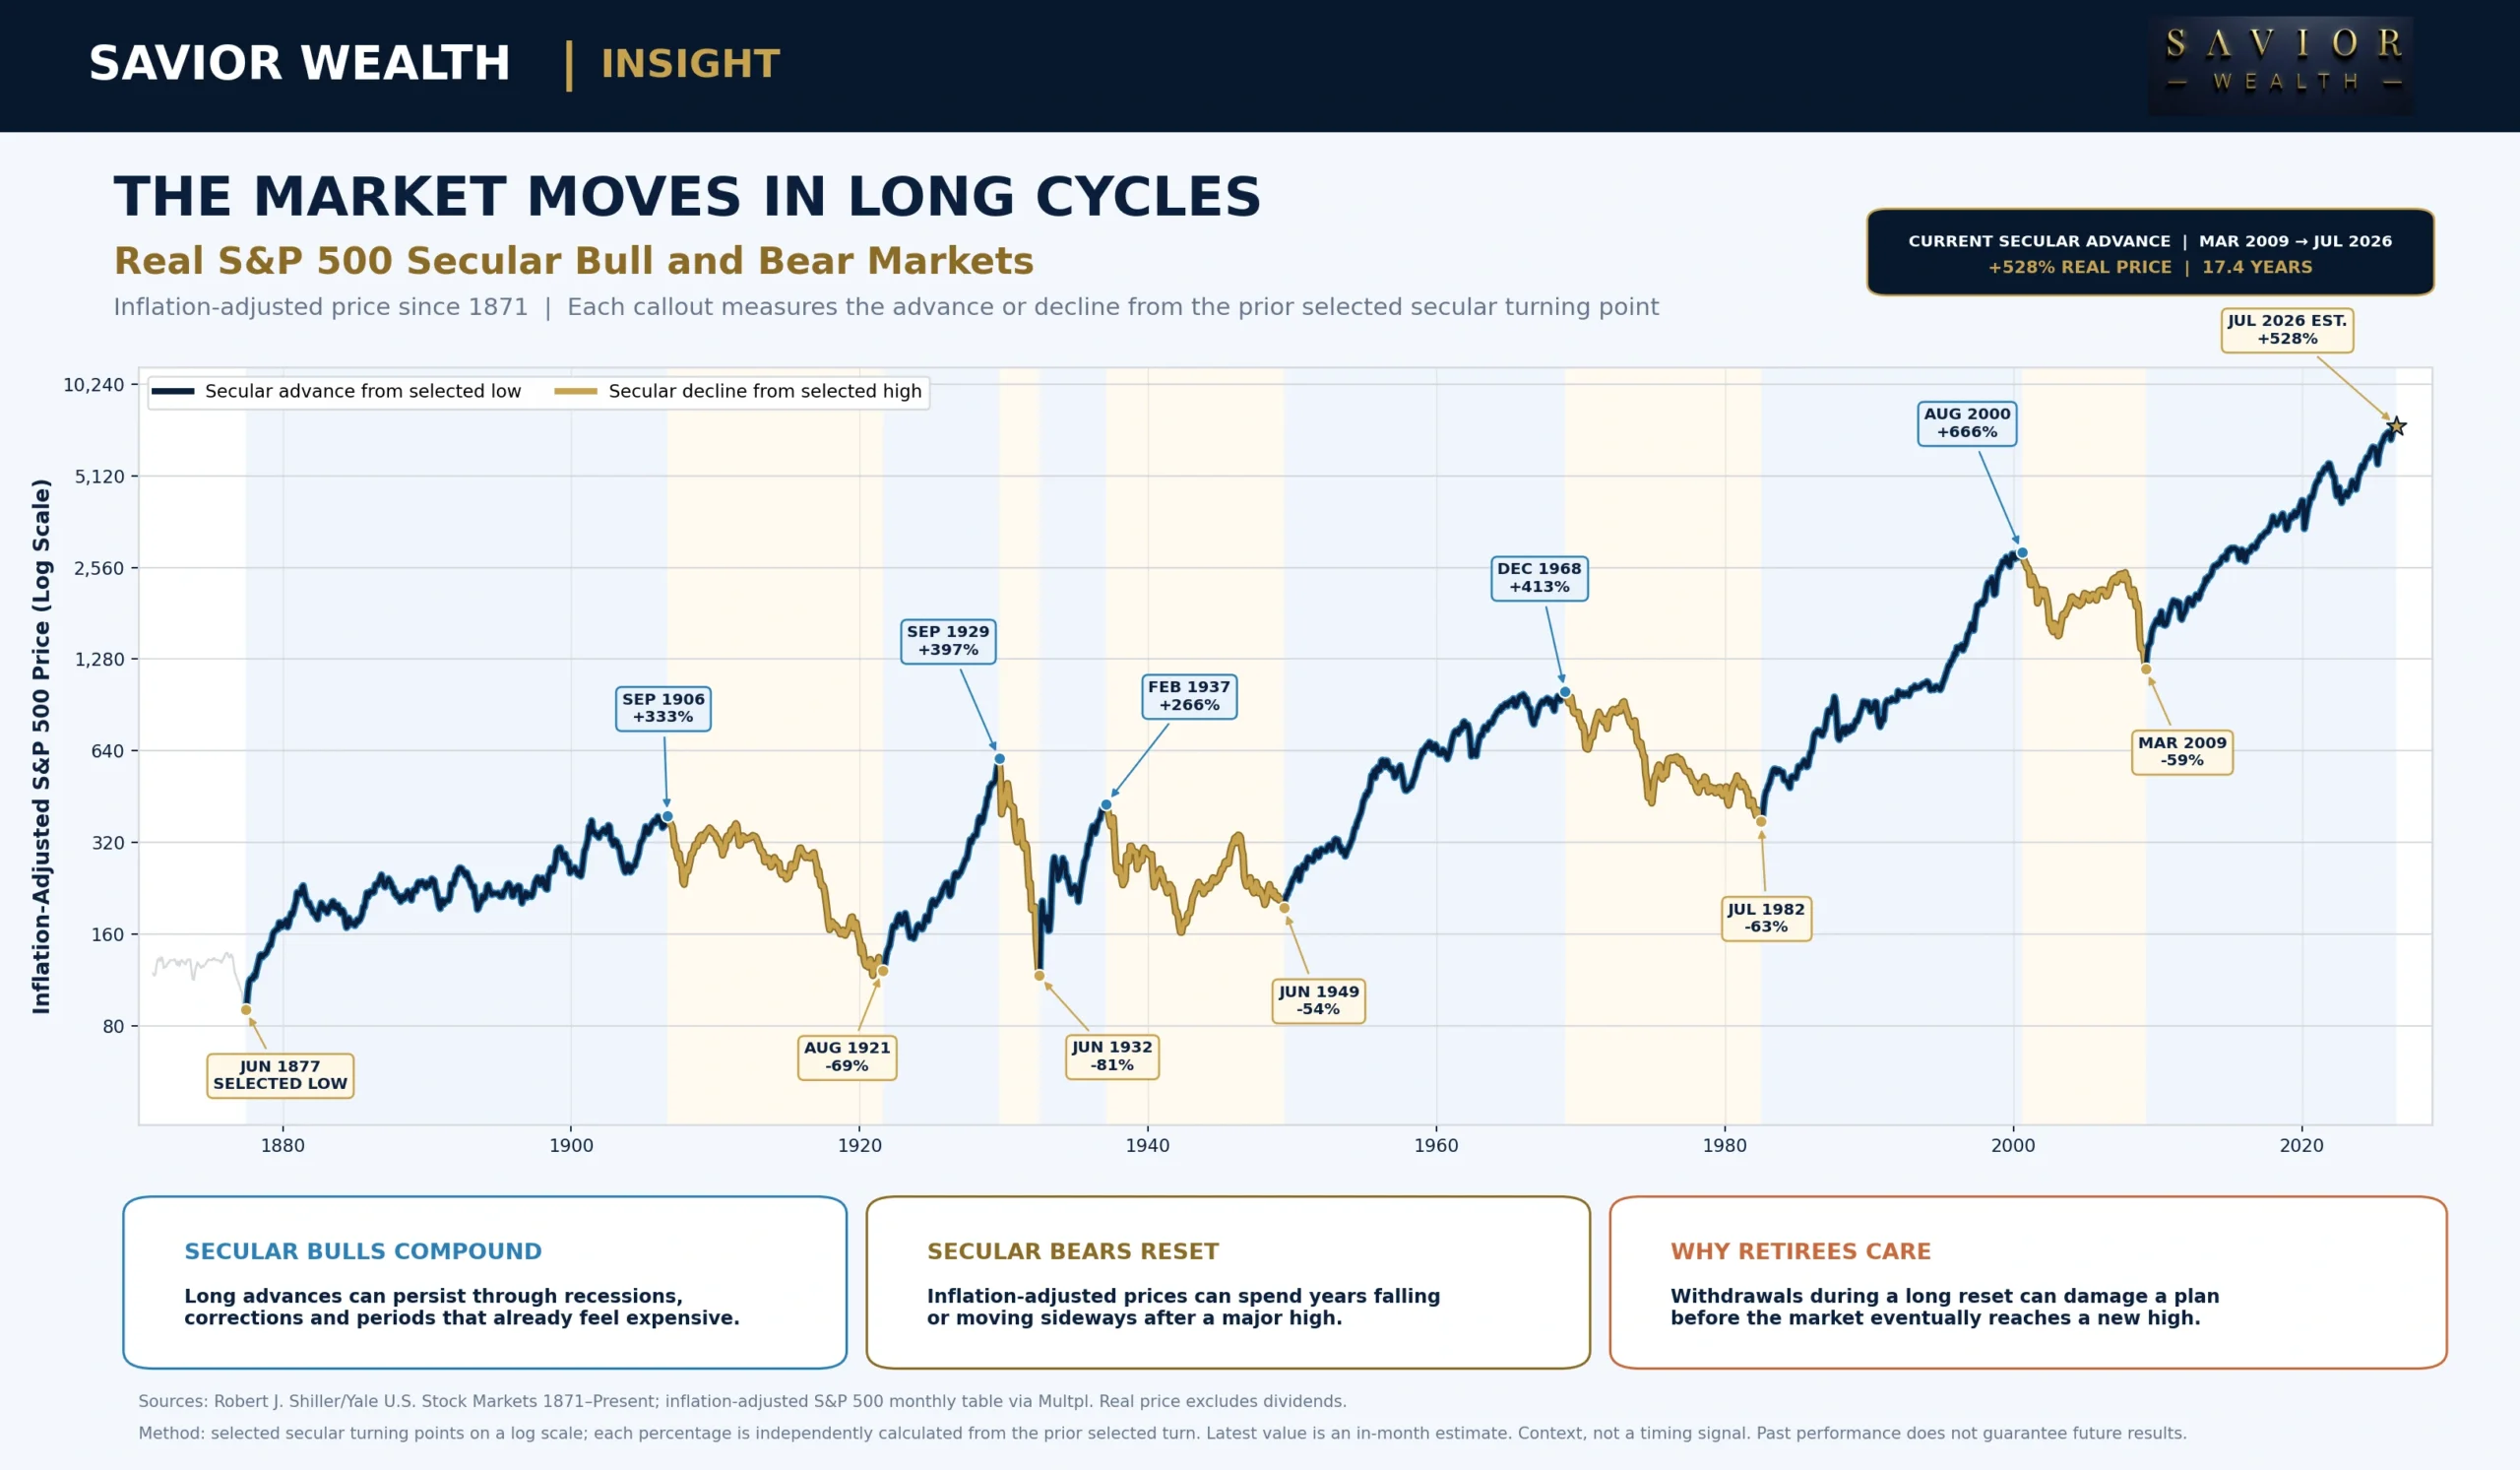
These cycles do not repeat on a fixed schedule. The chart’s value is more practical: it reminds us that the same “average return” can produce radically different investor experiences depending on when the plan begins.
The Retiree’s Real Question: “Does My Plan Say I Have to Go Back to Work?”
That is how one client framed the issue—and it is a far more useful question than asking whether the S&P 500 will be higher 25 years from now.
Consider a hypothetical retiree who began January 2000 with:
- $1,000,000 invested entirely in the S&P 500
- $40,000 of first-year spending, equal to a 4% initial withdrawal rate
- Monthly withdrawals that maintained the same inflation-adjusted purchasing power
- Dividends included in the total-return series
This was not an unreasonable plan built around an obviously reckless withdrawal rate. The problem was the starting point and the order in which returns arrived.
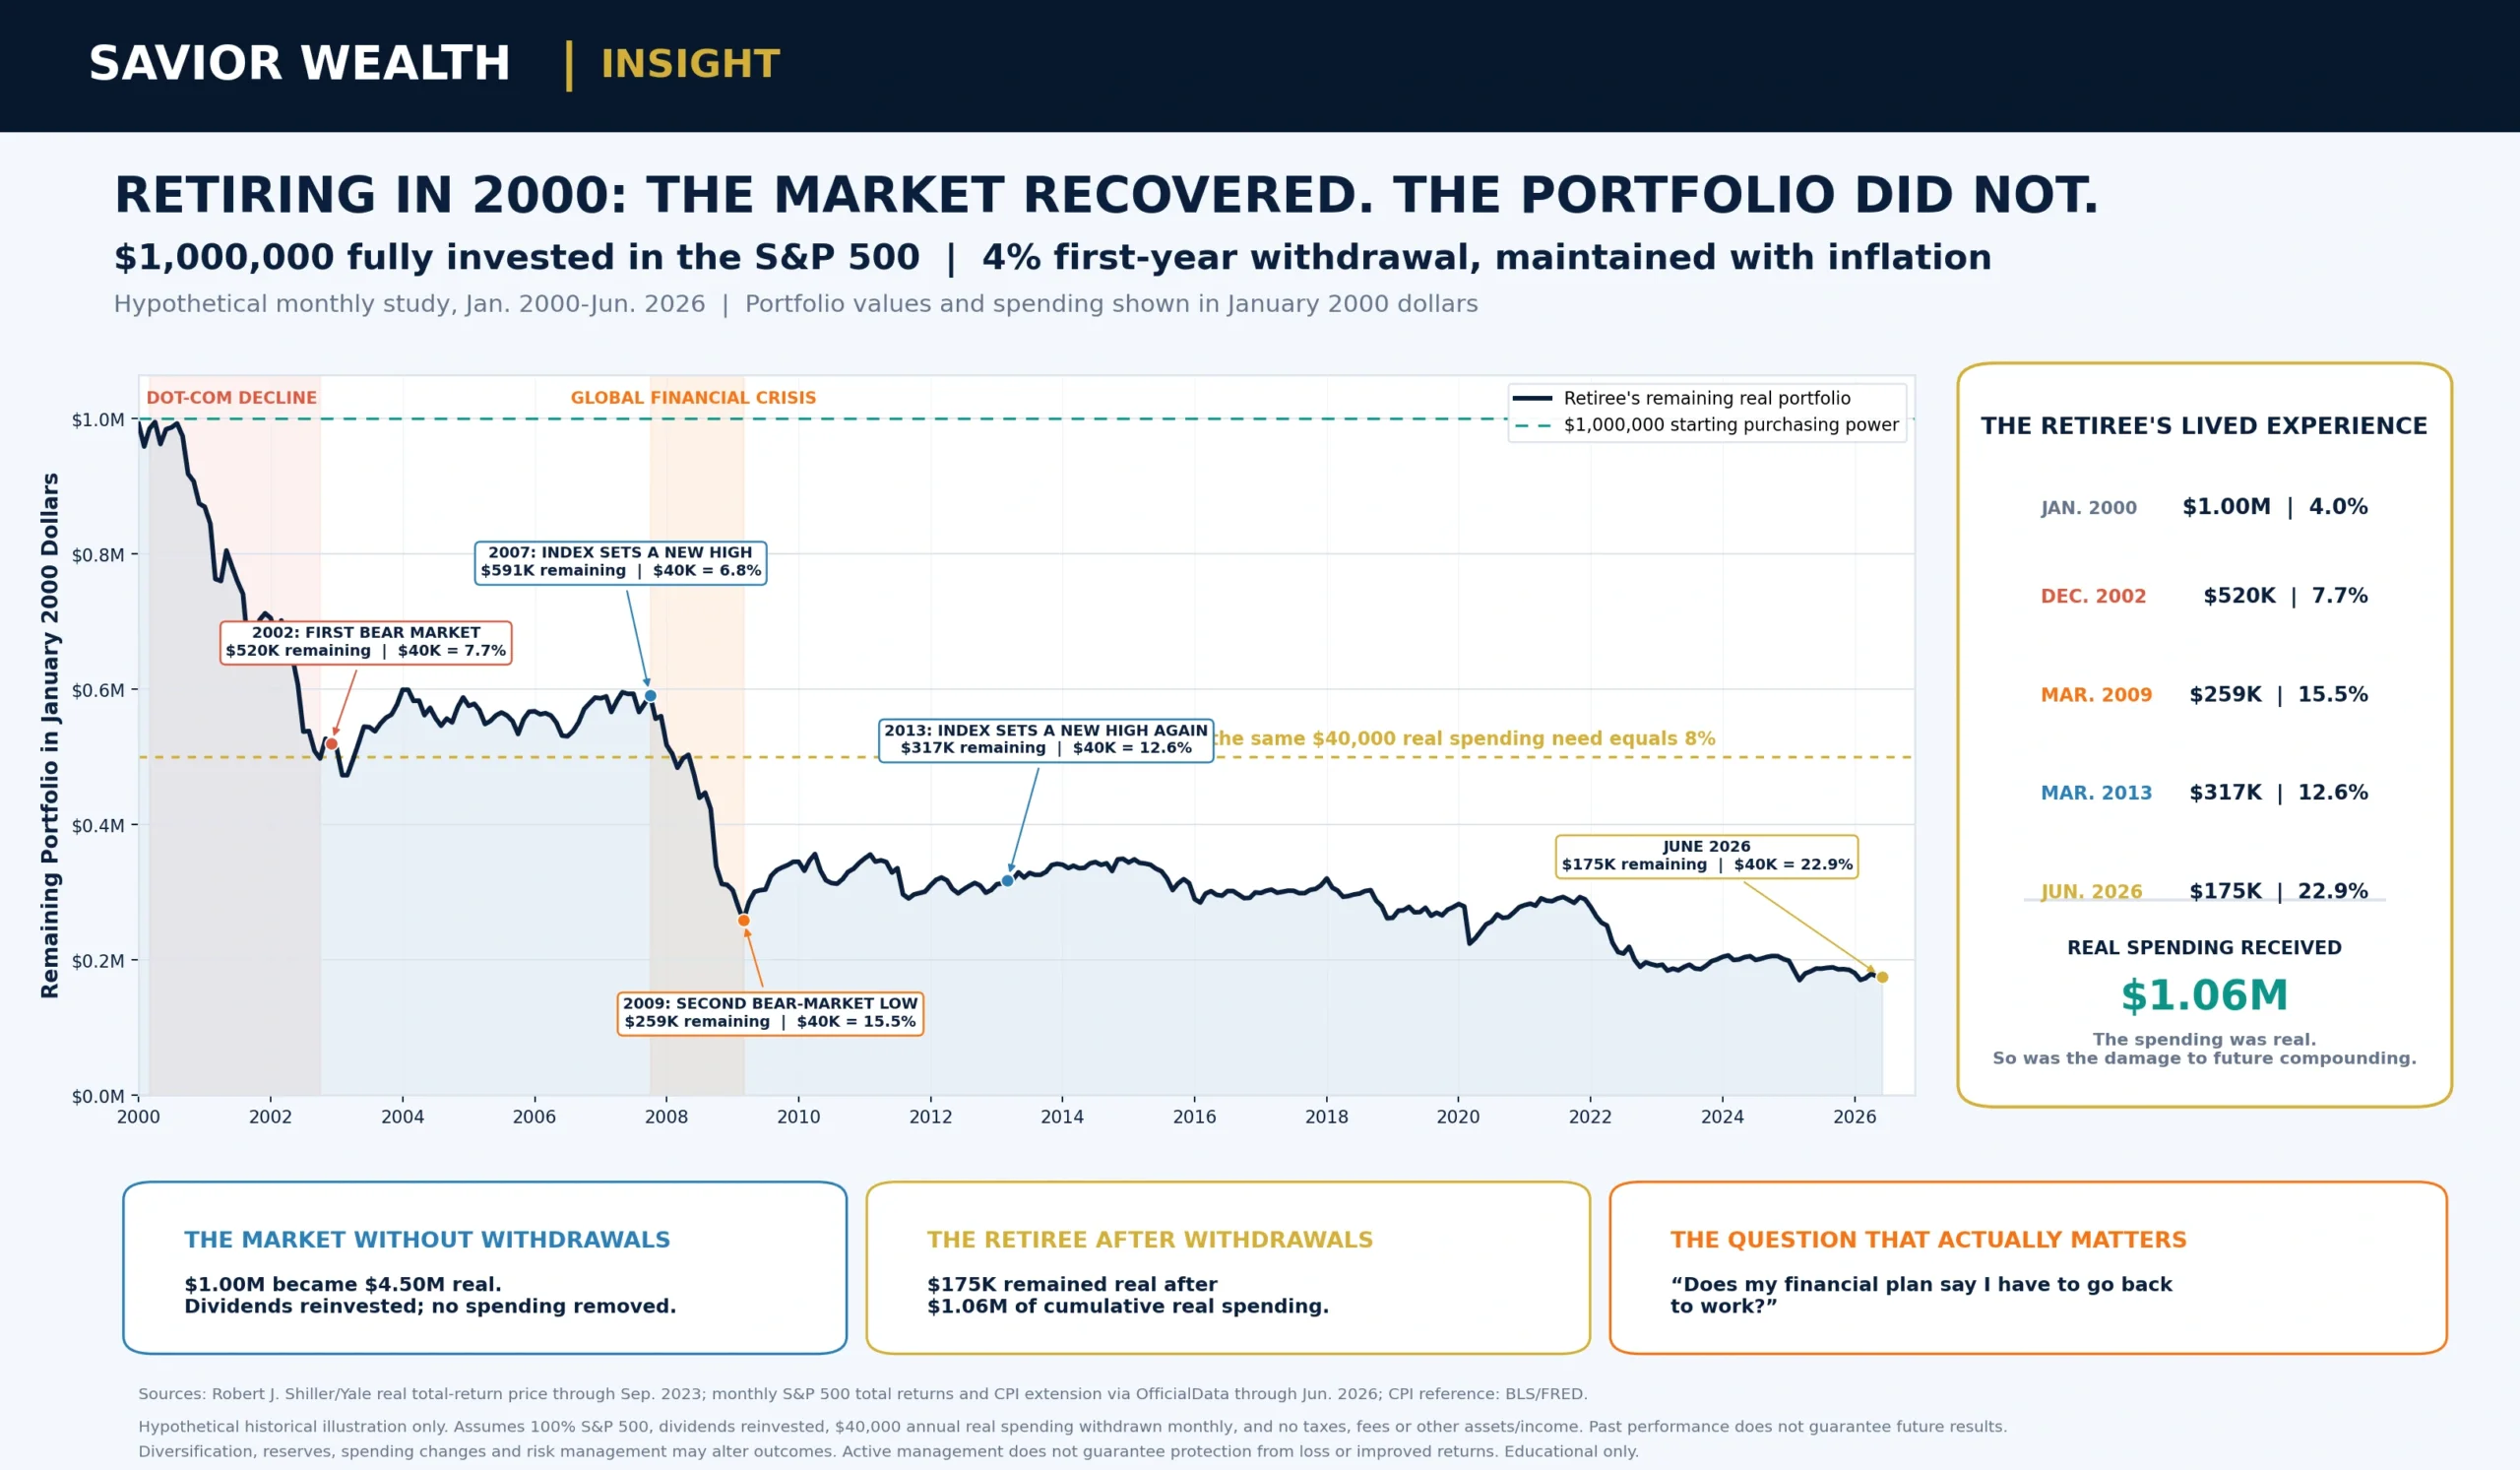
By December 2002, the portfolio had fallen to approximately $520,000. The same $40,000 of real annual spending now represented about 7.7% of the remaining balance.
The market recovered into 2007, but the retiree’s portfolio did not recover to 1million.Itreachedapproximately * *591,000** in October 2007 because withdrawals continued while the portfolio was rebuilding. Then the global financial crisis arrived.
By March 2009:
- The portfolio had fallen to approximately $259,000.
- The original $40,000 of real annual spending equaled roughly 15.5% of the remaining balance.
- A matching $1 million S&P 500 investment with no withdrawals was worth approximately **$492,000**.
When the S&P 500 finally regained its prior nominal high around March 2013, the retiree’s inflation-adjusted portfolio was only about $317,000. The market had recovered; the spending portfolio had not.
By June 2026, the hypothetical retiree had received approximately 1.06millionofcumulativeinflation − adjustedwithdrawals * *,butonlyabout * *175,000 remained. The same initial investment without withdrawals had grown to approximately $4.50 million in real terms.
This does not mean that a 4% withdrawal rule always fails. It does not mean every retiree should avoid stocks, and it does not represent an actual client result. It shows why a fully invested equity portfolio, a high starting valuation and fixed real withdrawals can be a dangerous combination.
The financial-plan question is not merely, “What is the average return?” It is:
How much loss can this plan absorb—while still funding the next withdrawal—before spending must be reduced, goals must change or earned income must resume?
Why Buy-and-Hold Investors Should Pay Attention
Buy-and-hold remains one of the most effective ways to avoid emotional trading, reduce friction and participate in long-term business growth. Nothing in these charts changes that.
But “stocks have done well over the long run” is not the same as “stocks deliver the same return from every starting price.”
Valuation matters to a financial plan in at least four ways:
Expected returns
If a plan assumes that a stock-heavy portfolio will compound at an above-average rate, a decade of merely average, below-average or negative real returns could leave a gap between the spreadsheet and the outcome.
Sequence-of-returns risk
For an investor still making regular contributions, lower prices may create opportunities to buy more shares. For a retiree taking withdrawals, poor returns early in retirement can be much more damaging because assets are being sold while the portfolio is depressed.
Concentration
A broad index can appear diversified while a small group of very large companies drives a disproportionate amount of its return. High valuation and high concentration can make the same earnings disappointment matter twice: first to the company, then to the index.
Investor behavior
The greatest risk is often not a forecast being wrong. It is discovering during a decline that the portfolio was built for a level of risk the investor could not tolerate.
The practical response is not necessarily to abandon equities. It is to understand what the current valuation asks of the future and make sure the portfolio, withdrawal plan and emotional risk tolerance can withstand a less generous decade.
What an Evidence-Based, Plan-Aware Process Can Add
Active management should not mean guessing every top, reacting to every headline or moving a portfolio all-in and all-out. It can mean connecting the financial plan to a repeatable risk-management process.
For Savior Wealth, that process can include:
- Financial-plan monitoring: measuring the return the plan actually requires, the liquidity needed for near-term spending and the portfolio loss the plan can tolerate.
- Valuation context: recognizing when long-horizon expected returns may be less generous and when the margin for disappointment is unusually small.
- Long-term trend evidence: monitoring measures such as the 10- and 12-month moving averages, breadth, credit and other technical signals for sustained deterioration or improvement.
- Measured adjustments: reducing equity risk when expensive markets also develop meaningful technical breakdowns, and considering greater equity exposure when valuations and market evidence become more favorable.
- Behavioral coaching: explaining what has changed, what has not changed and what the plan can withstand before fear or enthusiasm drives an undisciplined decision.
No moving average, valuation model or active process can guarantee protection or superior returns. Trend-following signals can lag, generate false signals and create additional taxes, costs or missed upside. The goal is not perfection. It is to avoid making the success of a retirement plan depend on one uninterrupted market path.
What Could Make Today’s High Valuations Work?
A balanced analysis has to acknowledge the other side.
Today’s leading companies are often more profitable, asset-light and globally diversified than the largest firms of earlier eras. Artificial intelligence could improve productivity, reduce costs and create new markets. Inflation can lift nominal revenues and GDP. A sustained decline in interest rates could also make future earnings more valuable.
Those forces could allow earnings and economic output to catch up with prices.
There is also no law requiring a valuation ratio to return to an old average. Accounting rules change, industry composition changes and the economy evolves. Any historical model can break.
That is why Savior Wealth does not view CAPE, the Buffett Indicator or price-to-sales as stand-alone trading systems. We view them as context—evidence that helps investors distinguish a favorable business story from an attractive investment price.
Savior’s Take
Do not panic. Do not become complacent.
The charts do not say the market must fall tomorrow. They say the starting price is demanding and the margin for disappointment may be smaller than many buy-and-hold assumptions suggest.
That leads to a more useful set of questions:
- What return does your financial plan require?
- How much of your portfolio depends on a small group of highly valued companies?
- Would your plan still work through a flat or disappointing decade after inflation?
- If you are withdrawing from the portfolio, how are you managing sequence-of-returns risk?
- At what portfolio value would your plan require a spending reduction or a return to earned income?
- Do you have a disciplined rebalancing, liquidity and tax-management process?
The objective is not to predict the exact path. It is to build a plan that does not require one perfect path to succeed.
You can follow Savior Wealth’s current market evidence on the Compass Dashboard and read our analysis of how concentration and AI spending can move broad indexes in The AI Capital Loop.
Summary
What is CAPE? The Shiller CAPE ratio compares current stock prices with 10 years of inflation-adjusted earnings. It is designed to provide long-term valuation context.
What is the Buffett Indicator? It compares the market value of corporate equities with nominal U.S. GDP. The Q1 2026 third estimate was 218.1%.
Does a high CAPE or Buffett Indicator predict a crash? No. Neither measure reliably identifies short-term market tops. High readings have historically been more useful for setting long-horizon return expectations.
How can the Buffett Indicator fall? Stock prices can decline, GDP can grow faster than market value, or both can occur over time.
What does this mean for buy-and-hold investors? Buy-and-hold can remain appropriate, but current valuations suggest investors should stress-test expected returns, concentration, liquidity needs and sequence-of-returns risk.
Why does the retirement starting point matter? Withdrawals made during early losses remove shares that can no longer participate in a later recovery. A market can regain its old high while a retiree’s spending portfolio remains permanently impaired.
Does active risk management guarantee a better result? No. Valuation and trend signals can be early, late or wrong. Their potential value is in creating a disciplined process tied to the investor’s financial plan rather than relying on hope or an emotional decision during a decline.
Continue the Conversation
Subscribe to the Compass
Receive Savior Wealth’s market framework, evidence and investor education in plain English.
Request a Private Discovery Session
If you would like to test whether your portfolio and financial plan can withstand a wider range of market outcomes, request a confidential conversation with our team.
Sources and Further Reading
- Robert Shiller, Online Data: U.S. Stock Markets 1871–Present, Yale University.
- Board of Governors of the Federal Reserve System, Financial Accounts of the United States: Table F.51 Corporate Equities.
- U.S. Bureau of Economic Analysis, Gross Domestic Product, First Quarter 2026, Third Estimate.
- Advisor Perspectives / dshort, The Buffett Valuation Indicator: June 2026.
- Warren Buffett and Carol Loomis, Warren Buffett on the Stock Market, Fortune, December 2001.
- Multpl, S&P 500 Price-to-Sales Ratio and Quarterly Historical Table, citing Standard & Poor’s.
- Multpl, Inflation-Adjusted S&P 500 by Month, using Robert Shiller’s historical series.
- Federal Reserve Bank of St. Louis, Consumer Price Index for All Urban Consumers.
- OfficialData.org, S&P 500 Returns and Inflation by Month, used with Shiller data to extend the hypothetical retirement study.
- Hunter Lewis LLC, Bubble Trouble: The Dot-Com Bubble, reproducing Scott McNealy’s 2002 valuation remarks.
- PGA Tour, Maverick McNealy Biography, Career Record and First PGA Tour Victory.
- Golf Channel, At the Decision: McNealy Torn Between Golf and Business.
Important Disclosures
This material is provided for educational and informational purposes only and should not be construed as individualized investment, tax or legal advice, an offer or solicitation, or a recommendation to buy or sell any security or investment strategy. The views expressed are based on information believed to be reliable as of July 25, 2026, but data may be revised and no representation is made that the information is complete or error-free.
CAPE, the Buffett Indicator, price-to-sales ratios, trendlines, moving averages and regressions have important limitations. They are not stand-alone market-timing tools. Historical relationships may change, technical signals can be false or late, and any model-derived return estimate is hypothetical, does not reflect an investable portfolio and should not be interpreted as a forecast or guarantee.
The retirement illustration is hypothetical and is not an actual client result. It assumes a 100% S&P 500 allocation, reinvested dividends, constant inflation-adjusted withdrawals and no taxes, advisory fees, fund expenses or transaction costs. A diversified portfolio, cash reserves, other income, flexible spending, taxes, fees and different implementation choices would produce different results. Active or tactical management does not guarantee protection from loss or improved returns.
Past performance does not guarantee future results. Investing involves risk, including possible loss of principal. Real returns are adjusted for inflation. Diversification and asset allocation do not ensure a profit or protect against loss. References to securities, companies, indexes or third-party research are for illustrative and educational purposes only and do not constitute endorsements or investment recommendations.
Before acting, investors should consider their objectives, time horizon, liquidity needs, tax circumstances and tolerance for risk and consult their professional advisers as appropriate.
Audio disclosure: The accompanying podcast is an AI-generated educational discussion derived from this written Insight. It may simplify or paraphrase portions of the analysis; this article and its linked sources control. The recording is not individualized investment, tax, or legal advice, and listening does not create an advisory relationship with Savior Wealth.