QQQ Pattern Lab & Market Structure Report
Nasdaq 100 / large-cap growth technical and market-structure snapshot.
Data through 2026-07-31. Page refreshed 2026-07-31T16:42:09. Educational research only.
Savior’s Take
Nasdaq 100 / Mega-Cap Growth moved +0.65% on the latest completed day, +0.55% over the latest five trading days, and -5.13% over the latest month. The key read is whether this asset is confirming or diverging from SPY and the broader Market Structure Dashboard. Use the full Pattern Lab snapshot below to evaluate trend, support, resistance, and setup quality.
At a Glance
Price data as of 2026-07-31. Page refreshed 2026-07-31T16:42:09. Returns are price/level proxy returns and may differ from official index calculations.
| Latest | 687.99 | Latest available close / level as of 2026-07-31. |
| Latest completed day | +0.65% | One trading day price move. |
| 5 trading days | +0.55% | Latest completed trading week / 5-day move. |
| Prior week | -1.60% | The five trading days before the latest week. |
| Month / 21D | -5.13% | Approximate one-month trading return. |
| Quarter to date | -5.13% | Return from the first trading day of the current quarter. |
| Prior quarter | +26.17% | Return during the prior completed calendar quarter. |
| YTD | +12.48% | Return from the first trading day of the current year. |
| Trailing 12M | n/a | Approximate one-year trailing return. |
Day-by-Day Snapshot
Latest 5 Trading Days
|
Prior 5 Trading Days
|
Pattern Lab Technical Snapshot
| Pattern Score | 74.6 | |
| Watch Priority | 60.0 | |
| Pattern Read | Support failure / range breakdown | |
| Setup Qualifier | Confirmed weakness / repair needed | |
| Support | 694.88 | |
| Resistance | 735.03 | |
| Breakdown | 692.25 | |
| Volume Read | Recent distribution days exceed accumulation days, confirming seller pressure |
QQQ Pattern Lab Chart, Levels and Technical Read
Cached weekly Pattern Lab snapshot. Shows chart structure, support/resistance, trend context, Pattern Lab classification, and Savior’s Take where available.
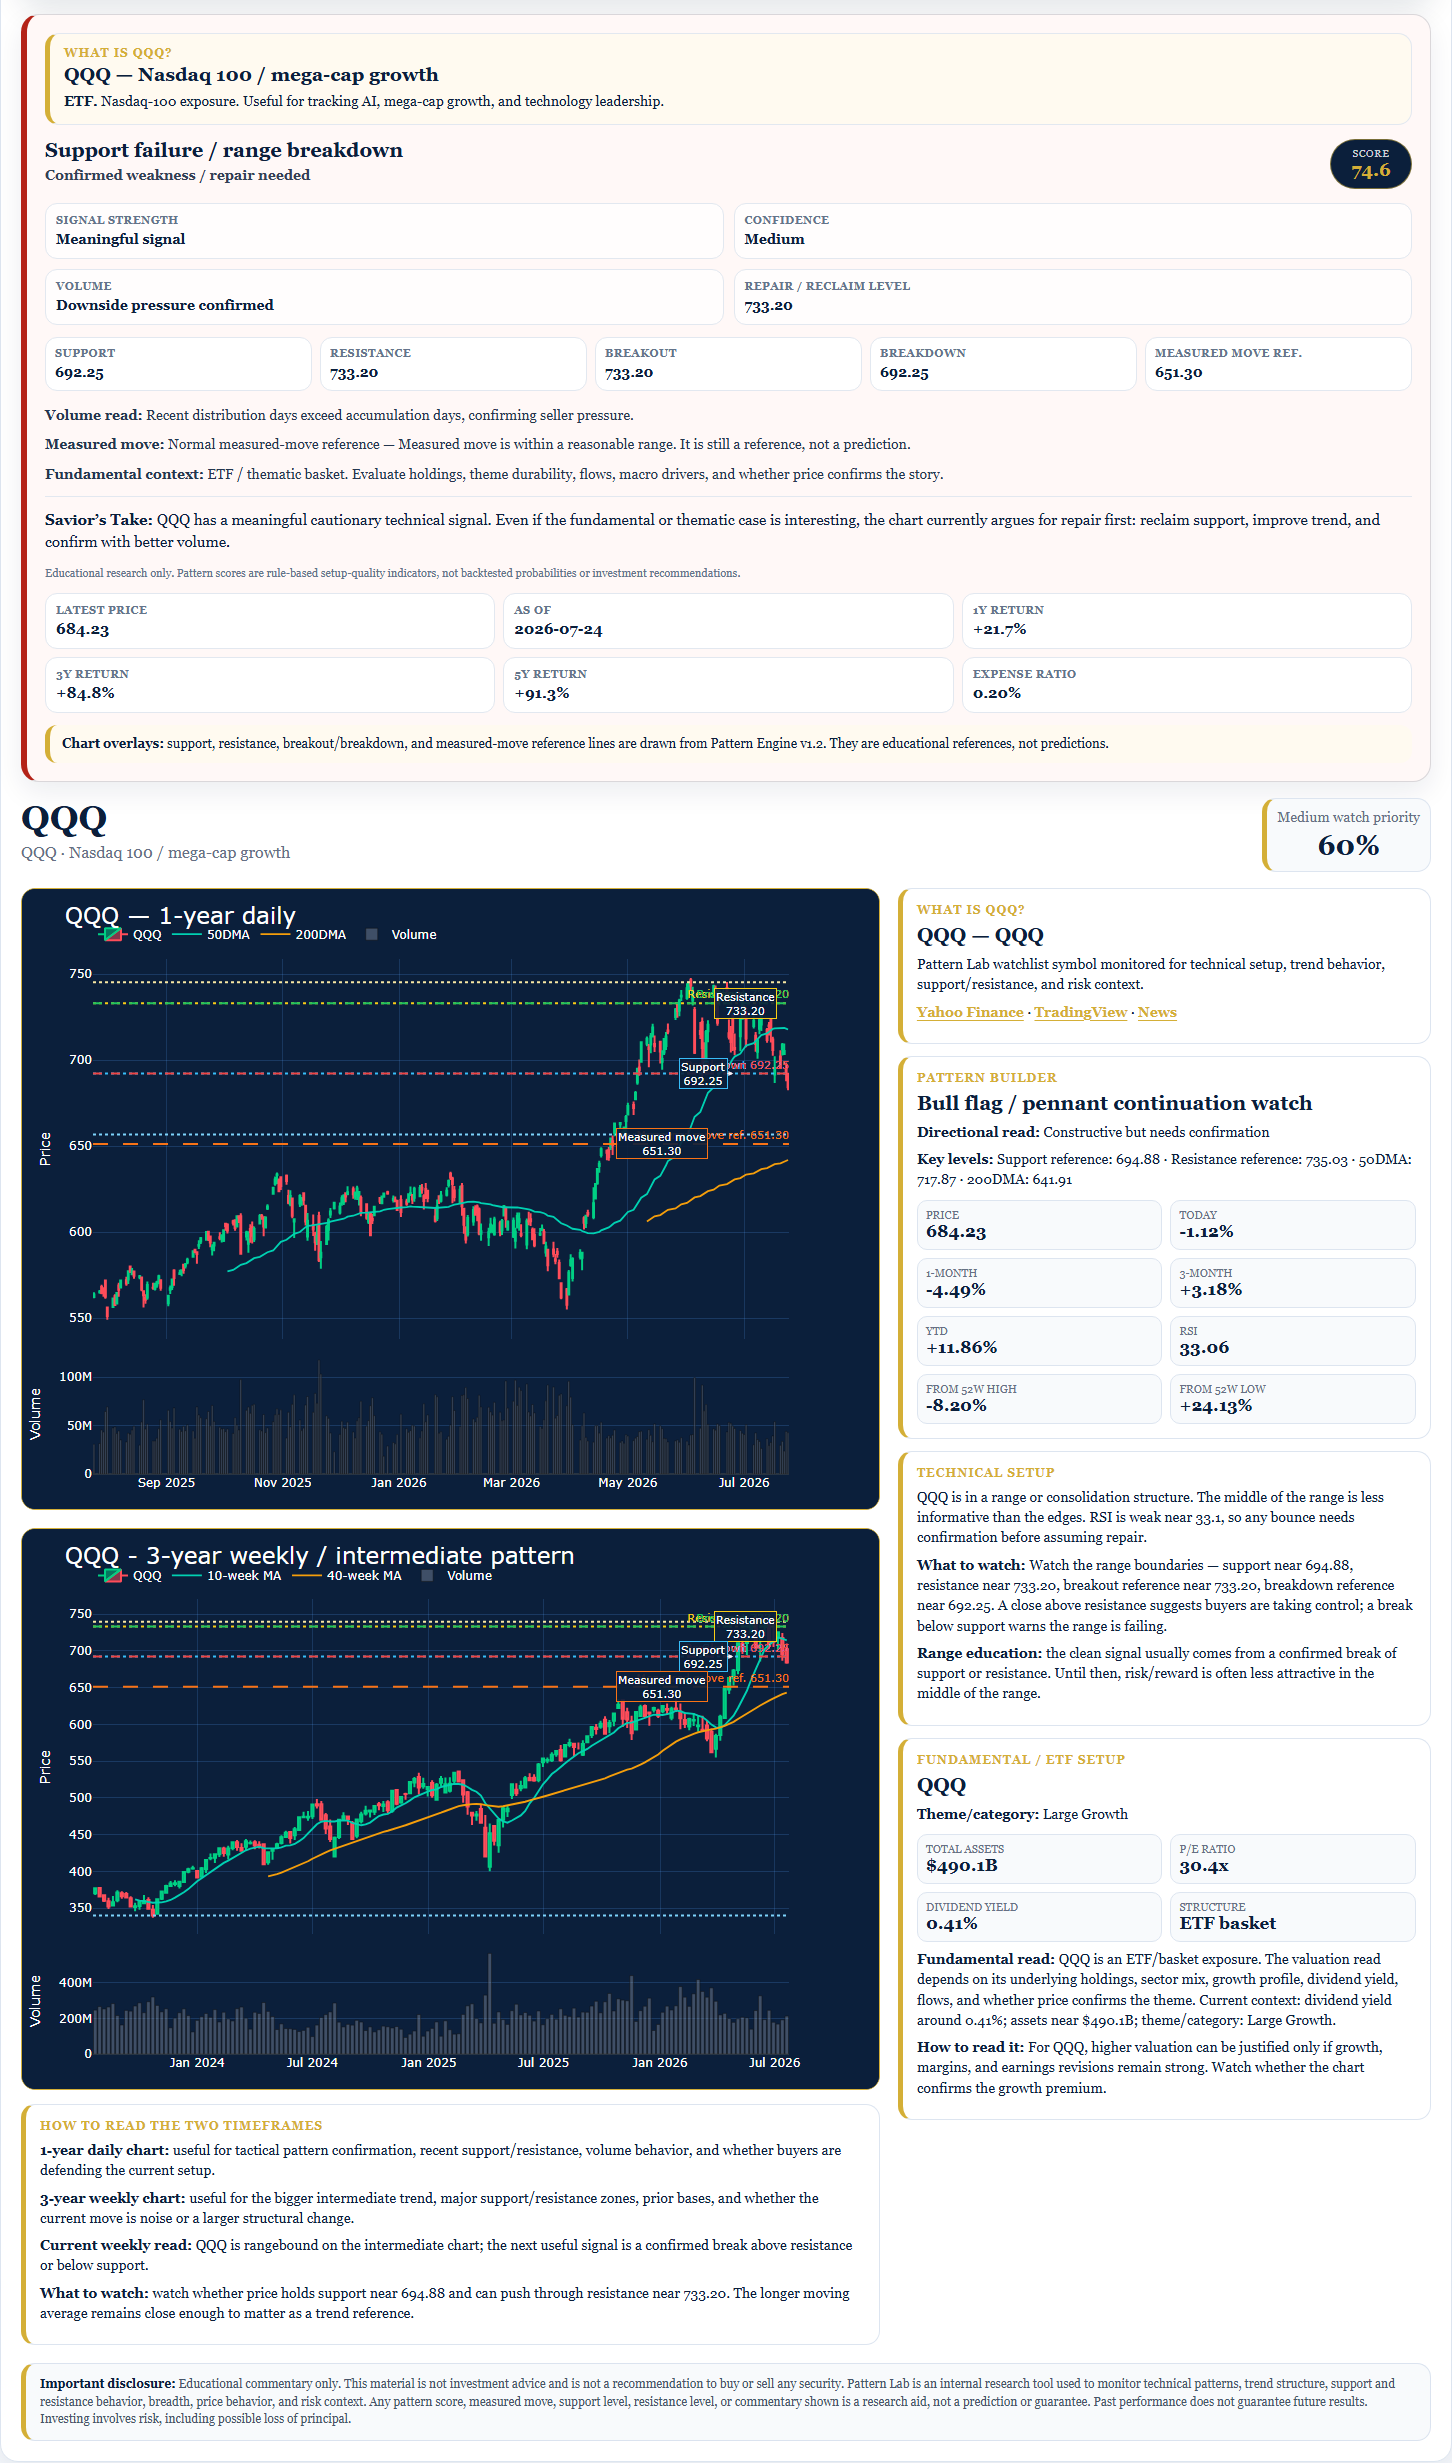
Snapshot cached 2026-07-26T11:16:02. Educational research only; not investment advice.
Important disclosure: Educational research only. This material is not investment advice and is not a recommendation to buy or sell any security. ETF, futures, rates, credit, and currency proxies may differ from official index, yield, or portfolio calculations.