
SCHM Pattern Lab & Mid-Cap Report
Mid-cap technical and market-structure snapshot.
Data through 2026-07-31. Page refreshed 2026-07-31T16:42:14. Educational research only.
Savior’s Take
SCHM is technically constructive, but not fully confirmed. The setup becomes more interesting if price clears resistance, holds the breakout or retest, and volume improves
At a Glance
Price data as of 2026-07-31. Page refreshed 2026-07-31T16:42:14. Returns are price/level proxy returns and may differ from official index calculations.
| Latest | 34.7 | Latest available close / level as of 2026-07-31. |
| Latest completed day | -0.26% | One trading day price move. |
| 5 trading days | -0.83% | Latest completed trading week / 5-day move. |
| Prior week | 0.00% | The five trading days before the latest week. |
| Month / 21D | -4.57% | Approximate one-month trading return. |
| Quarter to date | -4.57% | Return from the first trading day of the current quarter. |
| Prior quarter | +18.34% | Return during the prior completed calendar quarter. |
| YTD | +14.47% | Return from the first trading day of the current year. |
| Trailing 12M | n/a | Approximate one-year trailing return. |
Day-by-Day Snapshot
Latest 5 Trading Days
|
Prior 5 Trading Days
|
Pattern Lab Technical Snapshot
| Pattern Score | 61.0 | |
| Watch Priority | 60.0 | |
| Pattern Read | Base breakout watch | |
| Setup Qualifier | Constructive but volume unconfirmed | |
| Support | 34.36 | |
| Resistance | 35.97 | |
| Volume Read | Recent volume does not confirm the bullish setup yet |
SCHM Pattern Lab Chart, Levels and Technical Read
Cached weekly Pattern Lab snapshot. Shows chart structure, support/resistance, trend context, Pattern Lab classification, and Savior’s Take where available.
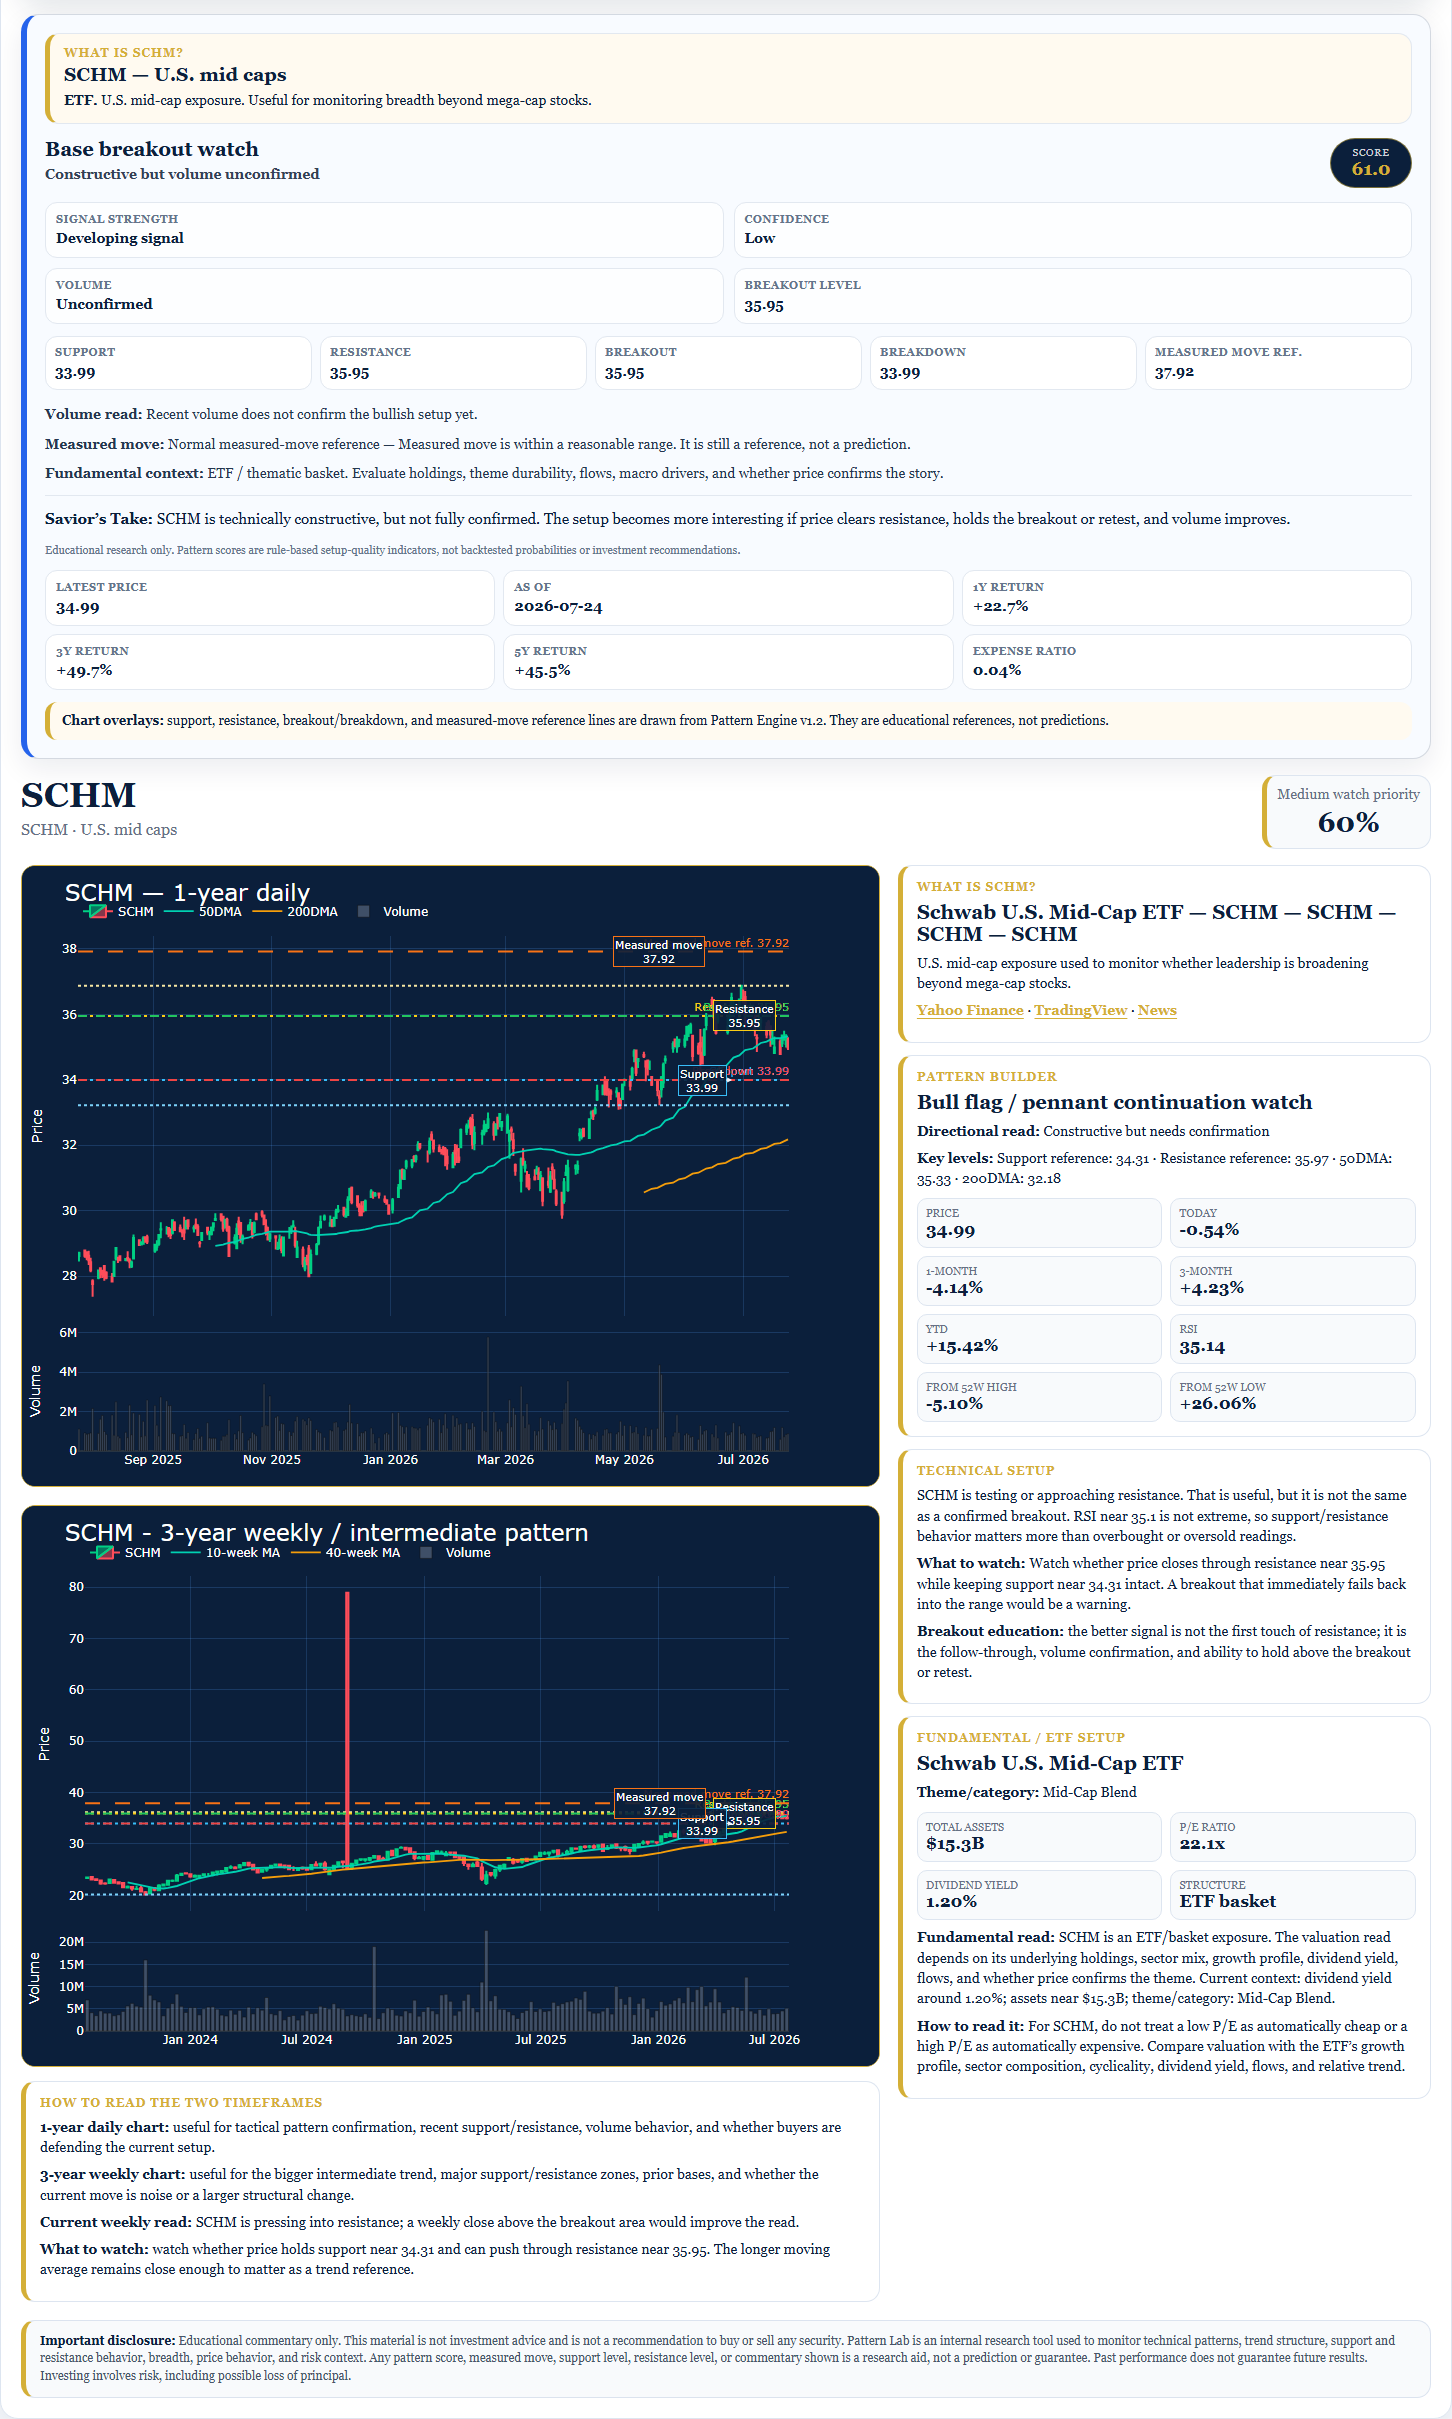
Snapshot cached 2026-07-26T11:18:07. Educational research only; not investment advice.
Important disclosure: Educational research only. This material is not investment advice and is not a recommendation to buy or sell any security. ETF, futures, rates, credit, and currency proxies may differ from official index, yield, or portfolio calculations.