
Crude Oil Pattern Lab & Market Report
Crude oil technical and cross-asset market snapshot. Uses CL=F for futures where available and USO as ETF proxy.
Data through 2026-07-31. Page refreshed 2026-07-31T16:42:28. Educational research only.
Savior’s Take
Crude Oil moved -5.15% over the latest five trading days. Oil can affect inflation expectations, energy equities, consumer pressure, and broader risk appetite. Use the day-by-day price action and Pattern Lab snapshot to separate short-term volatility from a sustained trend.
At a Glance
Price data as of 2026-07-31. Page refreshed 2026-07-31T16:42:28. Returns are price/level proxy returns and may differ from official index calculations.
| Latest | 84.71 | Latest available close / level as of 2026-07-31. |
| Latest completed day | +1.34% | One trading day price move. |
| 5 trading days | -5.15% | Latest completed trading week / 5-day move. |
| Prior week | +8.27% | The five trading days before the latest week. |
| Month / 21D | +23.52% | Approximate one-month trading return. |
| Quarter to date | +23.52% | Return from the first trading day of the current quarter. |
| Prior quarter | -30.58% | Return during the prior completed calendar quarter. |
| YTD | +47.78% | Return from the first trading day of the current year. |
| Trailing 12M | +22.31% | Approximate one-year trailing return. |
Day-by-Day Snapshot
Latest 5 Trading Days
|
Prior 5 Trading Days
|
Pattern Lab Technical Snapshot
| Pattern Score | 65.4 | |
| Watch Priority | 71.0 | |
| Pattern Read | Double bottom / reclaim watch | |
| Setup Qualifier | Constructive setup with improving volume | |
| Support | 109.0 | |
| Resistance | 142.83 | |
| Volume Read | Recent accumulation days exceed distribution days and latest volume is near or above average |
Crude Oil / USO Proxy Pattern Lab Chart, Levels and Technical Read
Cached weekly Pattern Lab snapshot. Shows chart structure, support/resistance, trend context, Pattern Lab classification, and Savior’s Take where available.
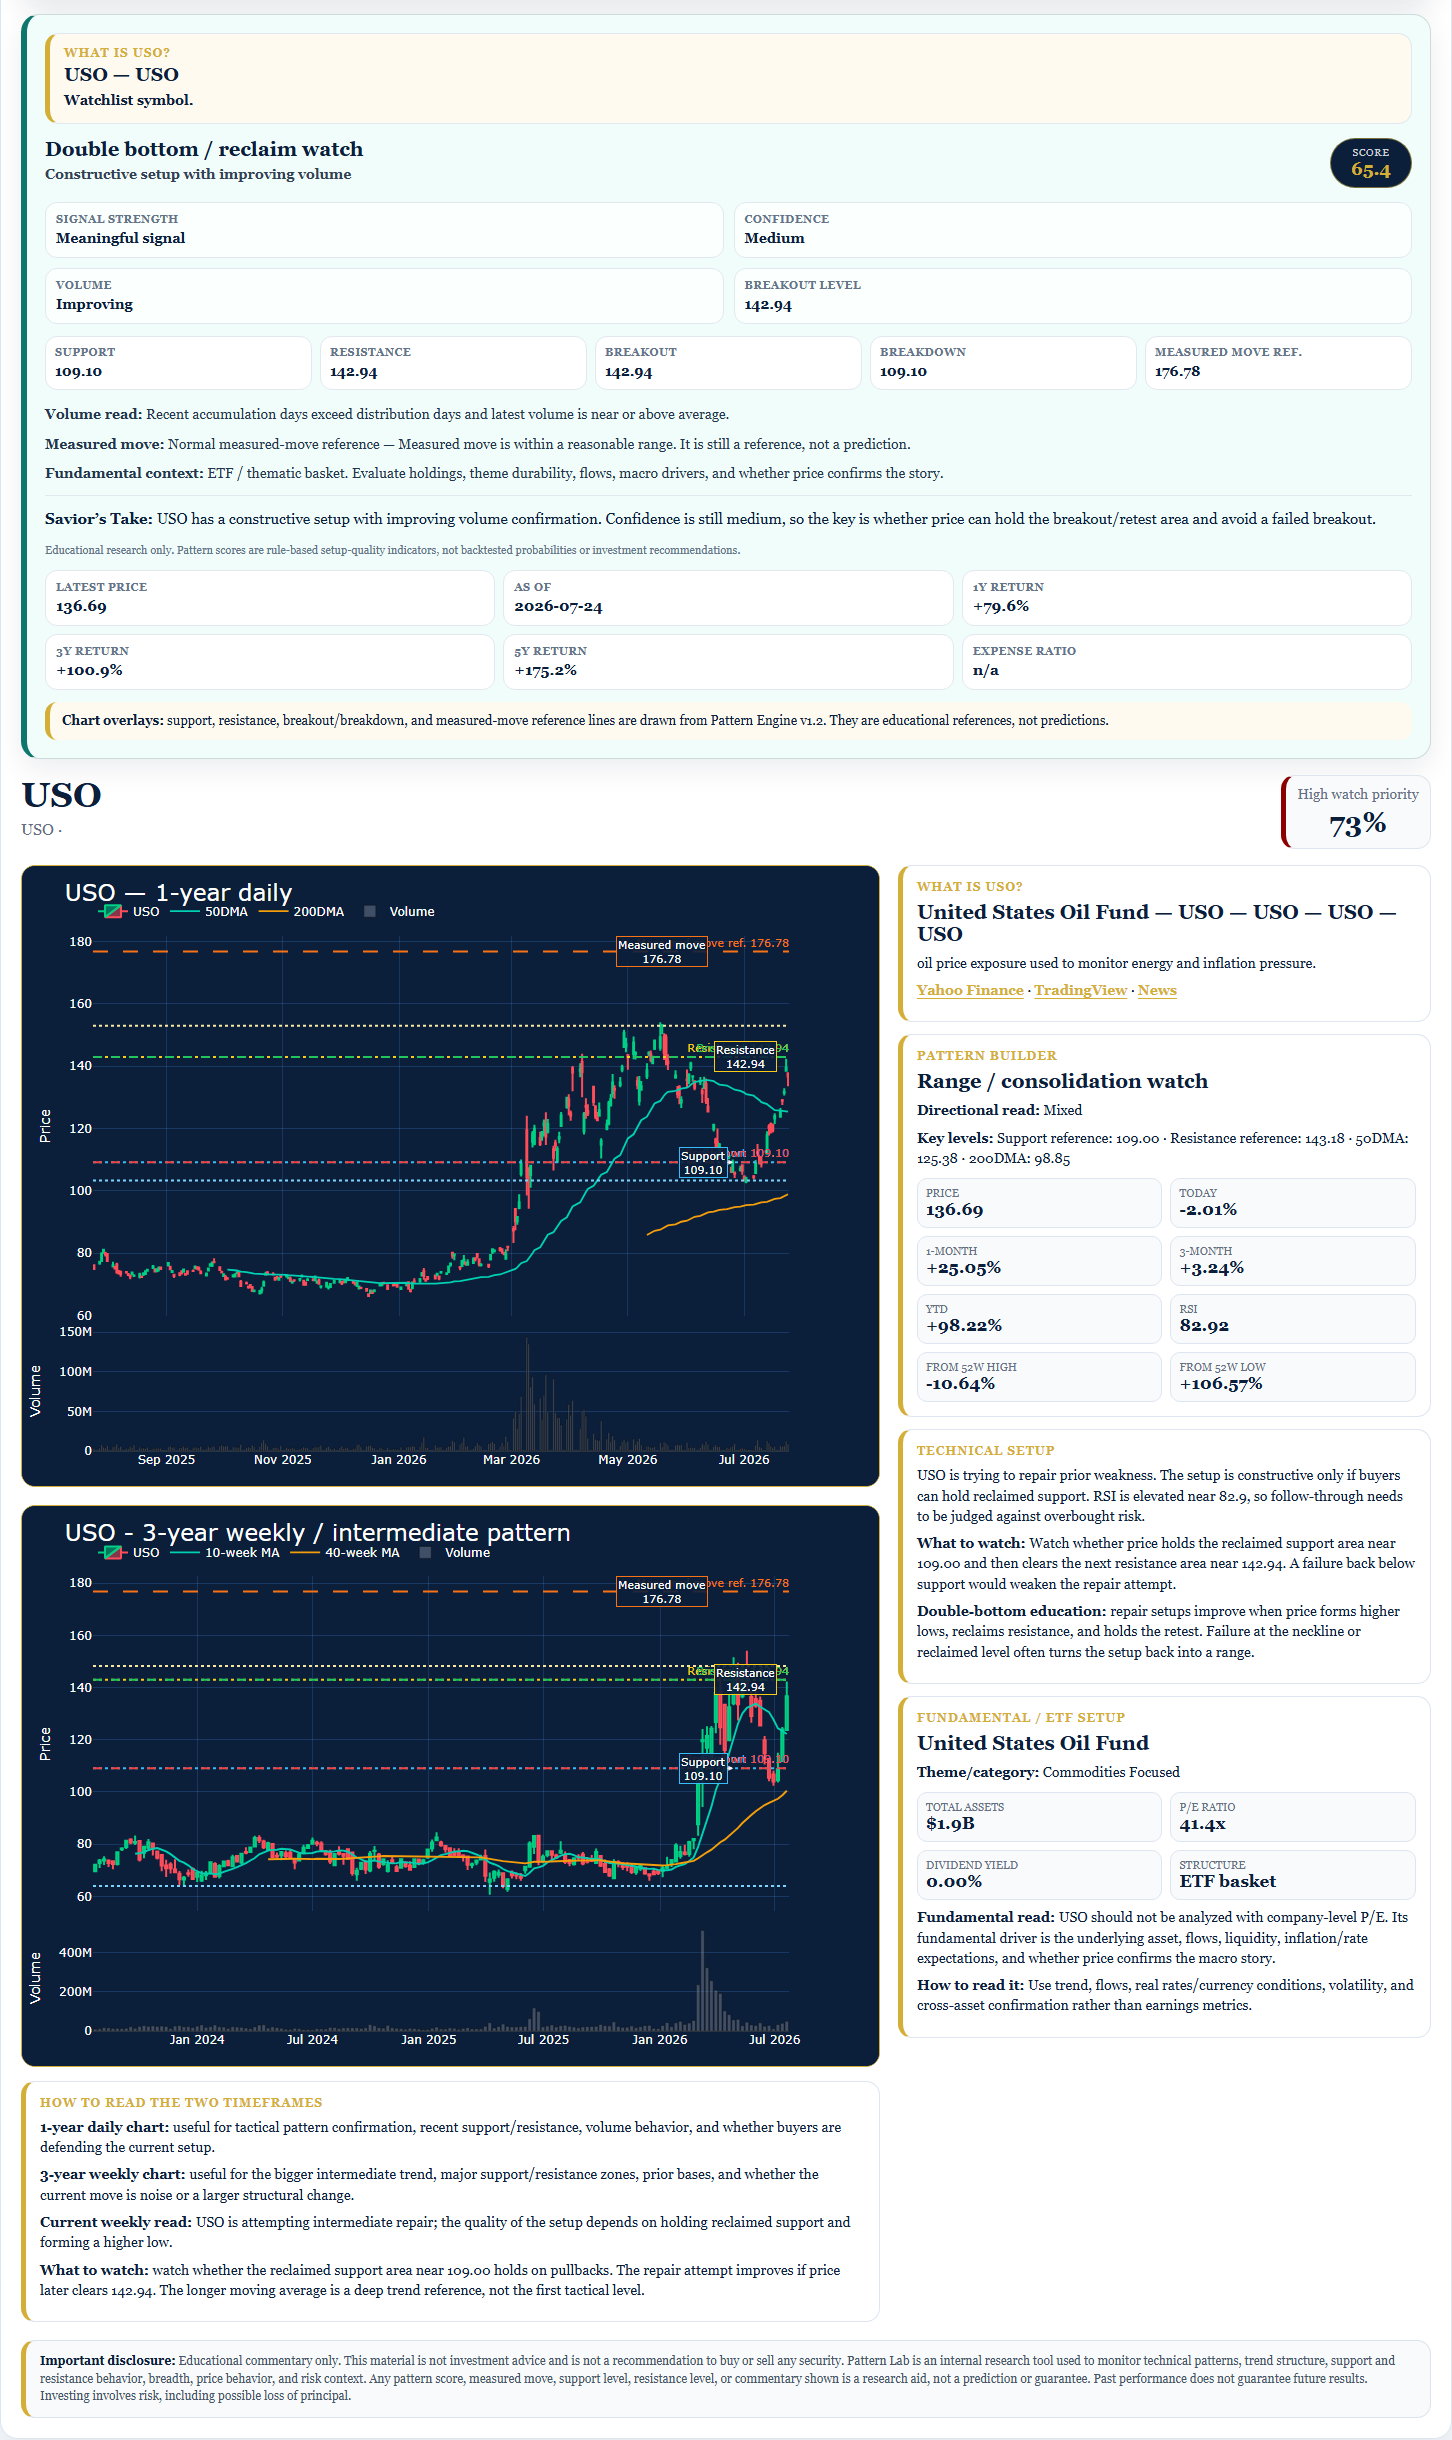
Snapshot cached 2026-07-26T11:26:11. Educational research only; not investment advice.
Important disclosure: Educational research only. This material is not investment advice and is not a recommendation to buy or sell any security. ETF, futures, rates, credit, and currency proxies may differ from official index, yield, or portfolio calculations.