
HYG High Yield Credit Report
High-yield credit market snapshot.
Data through 2026-07-31. Page refreshed 2026-07-31T16:42:52. Educational research only.
Savior’s Take
High Yield Credit is best read together with its rate or spread proxy. For the latest completed week, the price return was +0.32% while High Yield OAS moved +5 bps. That is the basic bond-market seesaw: rising yields usually pressure bond prices, while falling yields usually support them. Use this page to compare the ETF price move, the rate move, and the Pattern Lab snapshot before drawing conclusions.
At a Glance
Price data as of 2026-07-31. Page refreshed 2026-07-31T16:42:52. Returns are price/level proxy returns and may differ from official index calculations.
| Latest | 79.48 | Latest available close / level as of 2026-07-31. |
| Latest completed day | +0.01% | One trading day price move. |
| 5 trading days | +0.32% | Latest completed trading week / 5-day move. |
| Prior week | -0.53% | The five trading days before the latest week. |
| Month / 21D | -0.14% | Approximate one-month trading return. |
| Quarter to date | -0.14% | Return from the first trading day of the current quarter. |
| Prior quarter | +1.80% | Return during the prior completed calendar quarter. |
| YTD | +1.49% | Return from the first trading day of the current year. |
| Trailing 12M | n/a | Approximate one-year trailing return. |
Price Move vs. High Yield OAS
This table shows the ETF price move beside its closest rate, yield, or spread proxy. For most bond ETFs, prices and yields often move like a seesaw.
| Period | Price / Return | Rate / Yield / Spread | Rate Move |
|---|---|---|---|
| Current |
79.48 Price / level |
2.84% 2026-07-30 |
n/a High Yield OAS |
| Latest completed day 2026-07-30 to 2026-07-31 |
+0.01% Price return |
2.84% 2026-07-30 |
0 bps High Yield OAS |
| 5 trading days 2026-07-24 to 2026-07-31 |
+0.32% Price return |
2.84% 2026-07-30 |
+5 bps High Yield OAS |
| Prior week 2026-07-17 to 2026-07-24 |
-0.53% Price return |
2.79% 2026-07-24 |
+6 bps High Yield OAS |
| Month / 21D 2026-07-01 to 2026-07-31 |
-0.14% Price return |
2.84% 2026-07-30 |
+10 bps High Yield OAS |
| Quarter to date 2026-07-01 to 2026-07-31 |
-0.14% Price return |
2.84% 2026-07-30 |
+10 bps High Yield OAS |
| Prior quarter 2026-04-01 to 2026-06-30 |
+1.80% Price return |
2.75% 2026-06-30 |
-41 bps High Yield OAS |
| YTD 2026-01-02 to 2026-07-31 |
+1.49% Price return |
2.84% 2026-07-30 |
+1 bps High Yield OAS |
| Trailing 12M |
n/a Price return |
2.84% 2026-07-30 |
n/a High Yield OAS |
Day-by-Day Snapshot
Latest 5 Trading Days
|
Prior 5 Trading Days
|
Bond Prices and Interest Rates Move Like a Seesaw
Bond ETF prices and interest rates often move in opposite directions. When yields rise, existing bond prices usually fall; when yields fall, bond prices usually rise. The longer the duration, the more sensitive the ETF usually is to rate moves.
| Rate / Yield Proxy | Current | 1 Month Ago / Change | 6 Months Ago / Change | 12 Months Ago / Change |
|---|---|---|---|---|
| High Yield OAS BAMLH0A0HYM2 |
2.84% 2026-07-30 |
2.74% +10 bps |
2.80% +4 bps |
2.86% -2 bps |
| 10-Year Treasury Yield DGS10 |
4.68% 2026-07-30 |
4.48% +20 bps |
4.26% +42 bps |
4.37% +31 bps |
Rate data is shown as percent. Changes are shown in basis points. Rate data may update on a different cadence than ETF prices.
HYG Pattern Lab Chart, Levels and Technical Read
Cached weekly Pattern Lab snapshot. Shows chart structure, support/resistance, trend context, Pattern Lab classification, and Savior’s Take where available.
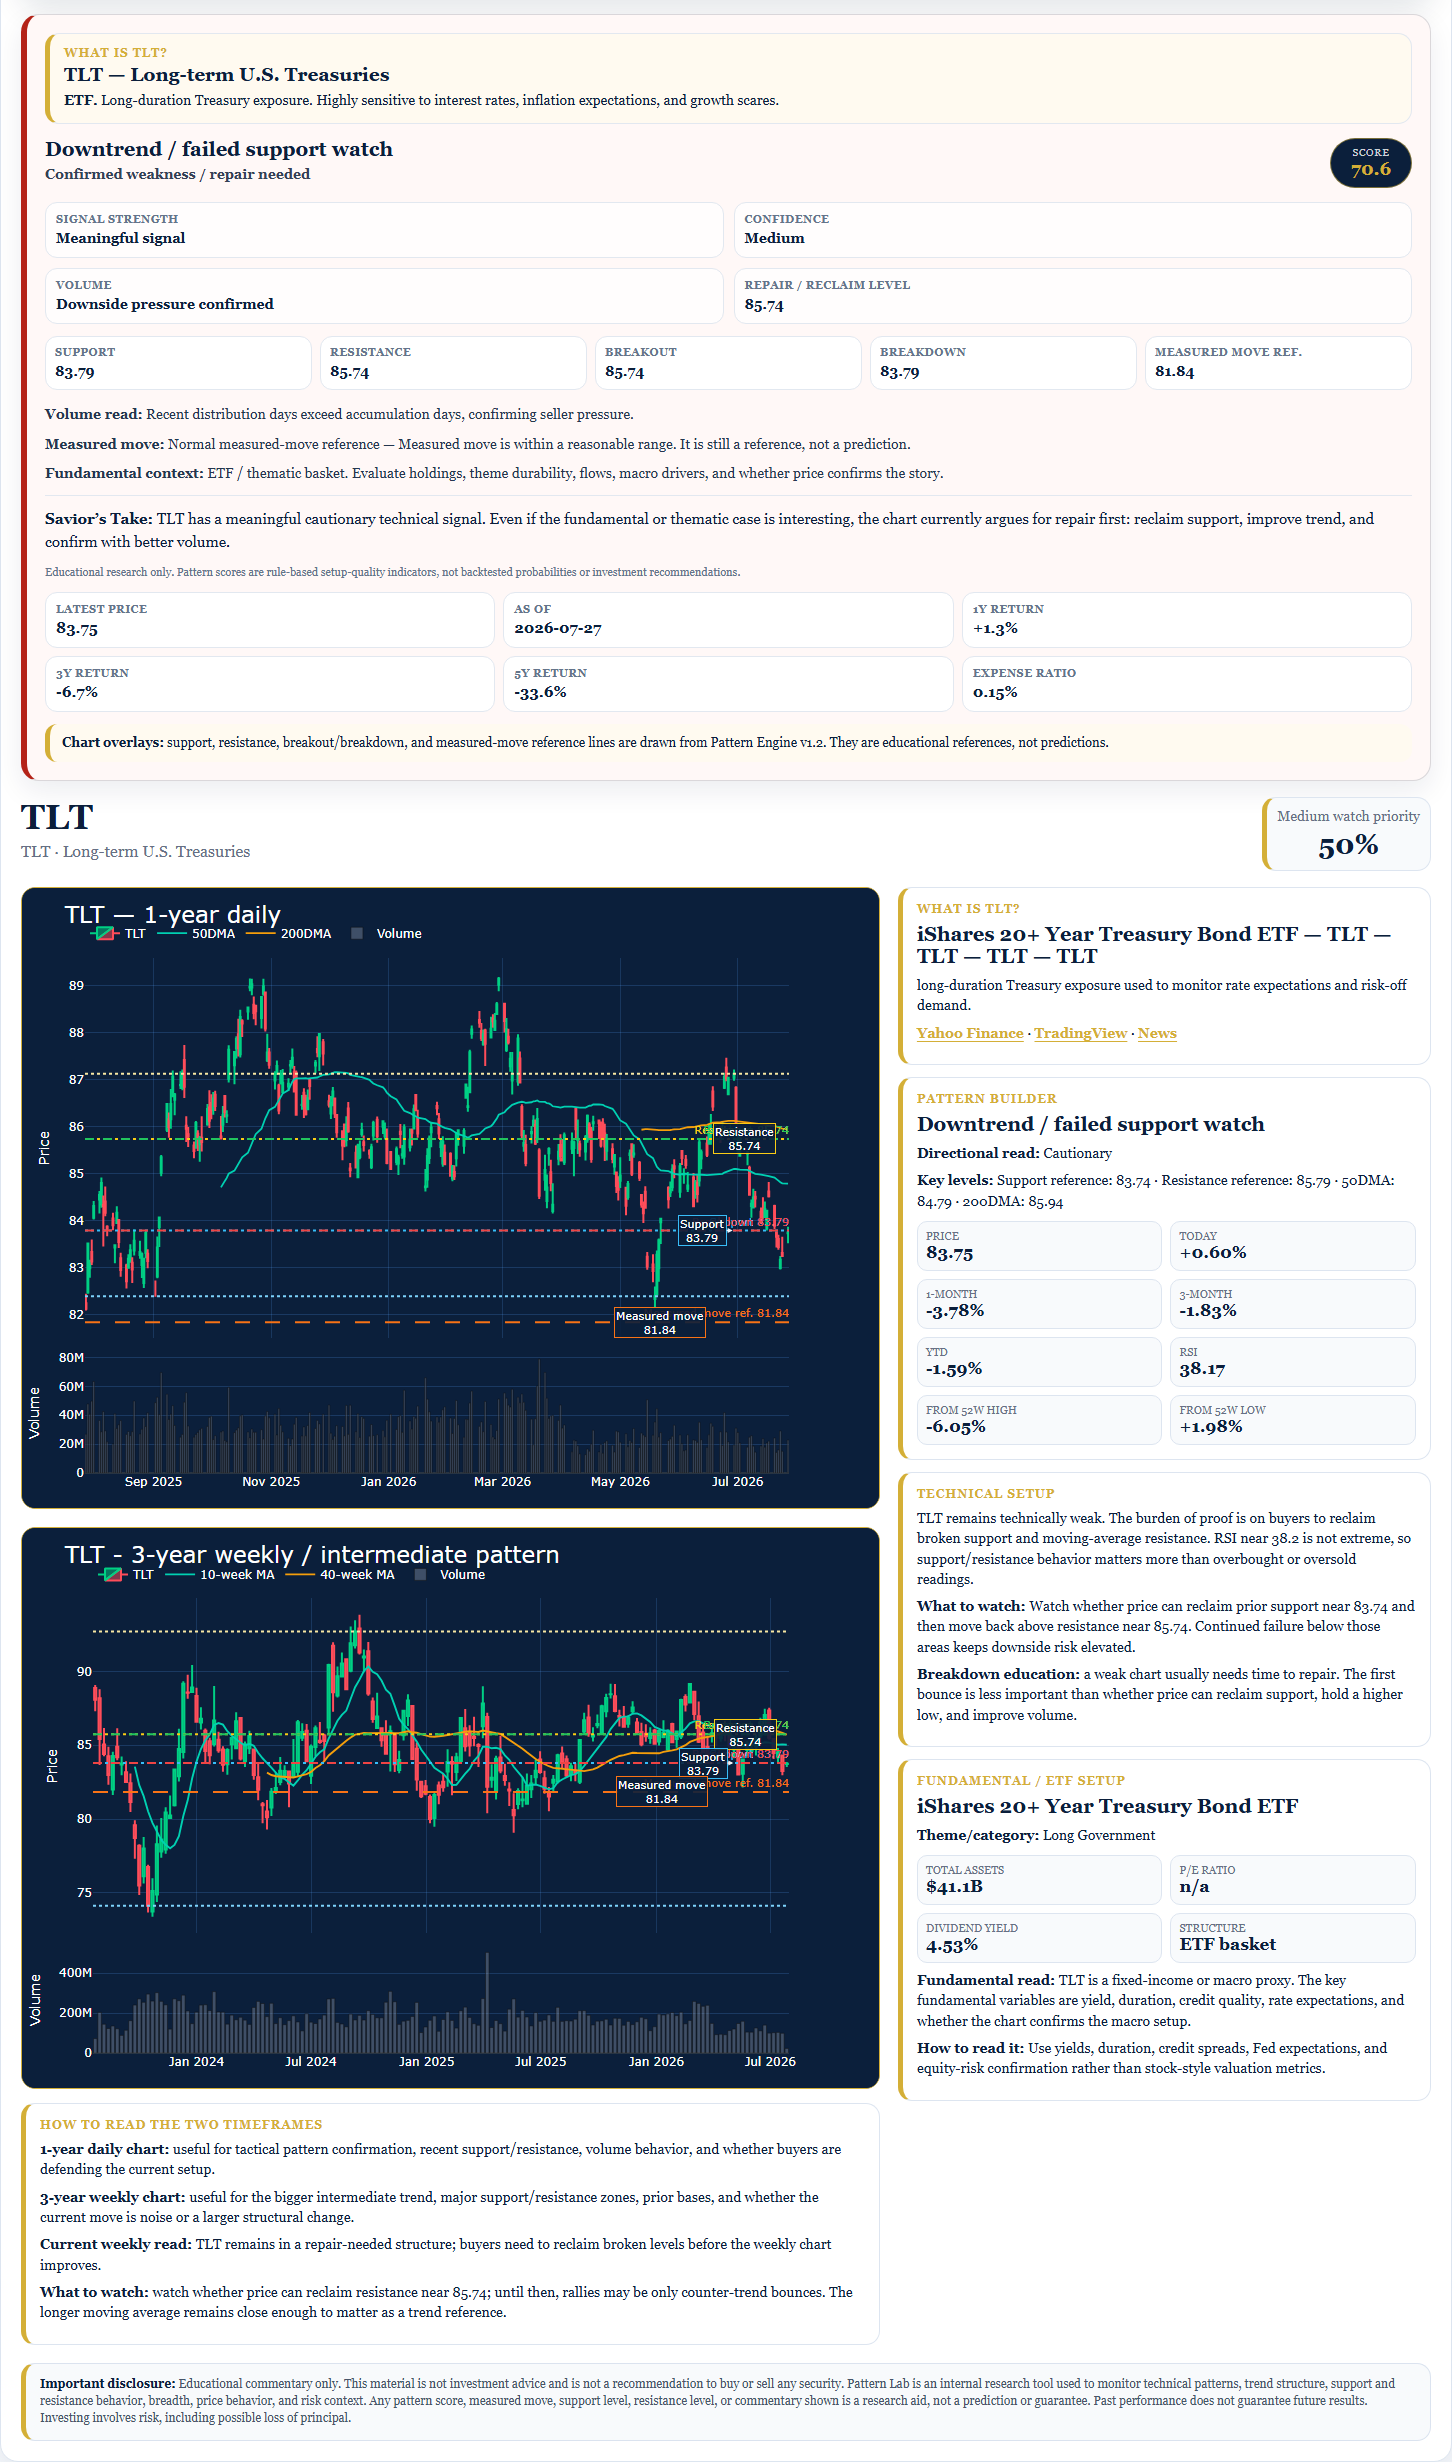
Snapshot cached 2026-07-27T18:07:26. Educational research only; not investment advice.
Important disclosure: Educational research only. This material is not investment advice and is not a recommendation to buy or sell any security. ETF, futures, rates, credit, and currency proxies may differ from official index, yield, or portfolio calculations.