
Market Structure Dashboard
Market Movers, leadership rotation, SPY technical context, and Charts of the Week. Updated 2026-07-31T17:00:50.
Market Movers — Daily and Weekly Read
Data note: Market Movers uses constituent-level market-cap attribution estimates. These are approximation tools and can differ from the live SPY ETF return, index vendor calculations, ETF timing, or data-provider updates. Use the figures for structure, leadership, and participation context rather than exact benchmark accounting.
Today’s Market Movers
|
As of
2026-07-31 |
Est. Cap-Weighted Return
+2.17% |
Est. Equal-Weight Return
+0.03% |
Top 50 Contribution
+2.170 pts |
|
Bottom 450 Contribution
-0.003 pts |
Largest $ Gainer
AMZN / $388.1B |
Largest $ Loser
AAPL / $-360.1B |
Weekly Market Movers
|
Week
2026-07-17 to 2026-07-24 |
Names Used
448 / 503 |
Est. Cap-Weighted Return
-1.31% |
Est. Equal-Weight Return
+0.08% |
|
Top 50 Contribution
-1.384 pts |
Bottom 450 Contribution
+0.077 pts |
Next 50 Contribution
+0.013 pts |
Next 100 Contribution
+0.101 pts |
|
Middle 100 Contribution
-0.014 pts |
Final 200 Contribution
-0.023 pts |
Largest $ Gainer
NVDA / $97.6B |
Largest $ Loser
GOOGL / $-330.6B |
Savior’s Take: This week had a more unusual split. the top 50 contributed -1.384 percentage points, but the bottom 450 contributed +0.077 percentage points. That suggests the headline index was pressured by larger companies while broader participation was more resilient.
Weekly Contribution by Market-Cap Bucket
| Bucket | Names | Contribution | Read |
|---|---|---|---|
| Top 50 1-50 |
50 | -1.384 pts | Largest companies / headline index leadership |
| Next 50 51-100 |
50 | +0.013 pts | Large but less dominant companies |
| Next 100 101-200 |
100 | +0.101 pts | Middle of the index |
| Middle 100 201-300 |
100 | -0.014 pts | Broader market participation |
| Final 200 301-end |
148 | -0.023 pts | Smallest S&P 500 constituents |
Educational research only. Market-cap attribution is estimated and may differ from official index or ETF calculations. Public dashboard links should not expose local file paths.
Sector, Subsector & Cross-Asset Pressure Map
This section focuses on what moved today across sectors, themes, commodities, rates, credit, currencies, crypto, and real estate. It complements Daily Market Movers, which focuses on constituent-level market-cap attribution.
Latest data date: 2026-07-31. ETF and asset-class proxies are approximation tools and may differ from official index, ETF, commodity, or portfolio results.
Savior’s Take: SPY is moving +0.72% in the latest daily data, so the details underneath the headline matter. Small caps are underperforming SPY, which points to weaker risk appetite beneath the headline index. Equal weight is lagging cap weight, suggesting broader participation is weaker than the headline index. The weakest sectors are led by XLB (Materials), while the best sector read is XLY (Consumer Discretionary). At the subsector/theme level, the biggest pressure is in GDXJ (Junior Gold Miners); the best relative area is OIH (Oil Services). Cross-asset confirmation: long Treasuries -0.66%; gold -1.49%; oil +1.33%; the U.S. dollar +0.11%. This report is designed to identify what moved today specifically, not one-year trends or slow-moving valuation context.
Major Proxies — Best Relative
|
Major Proxies — Weakest
|
||||||||||||||||||||
Sector Leaders
|
Sector Laggards
|
||||||||||||||||||||
Subsector / Theme Leaders
|
Subsector / Theme Laggards
|
||||||||||||||||||||
Cross-Asset Leaders
|
Cross-Asset Laggards
|
Educational research only. This is not investment advice and is not a recommendation to buy or sell any security.
Leadership & Rotation Digest
This section summarizes which size, style, sector, subsector, and custom basket groups are leading, lagging, or rotating.
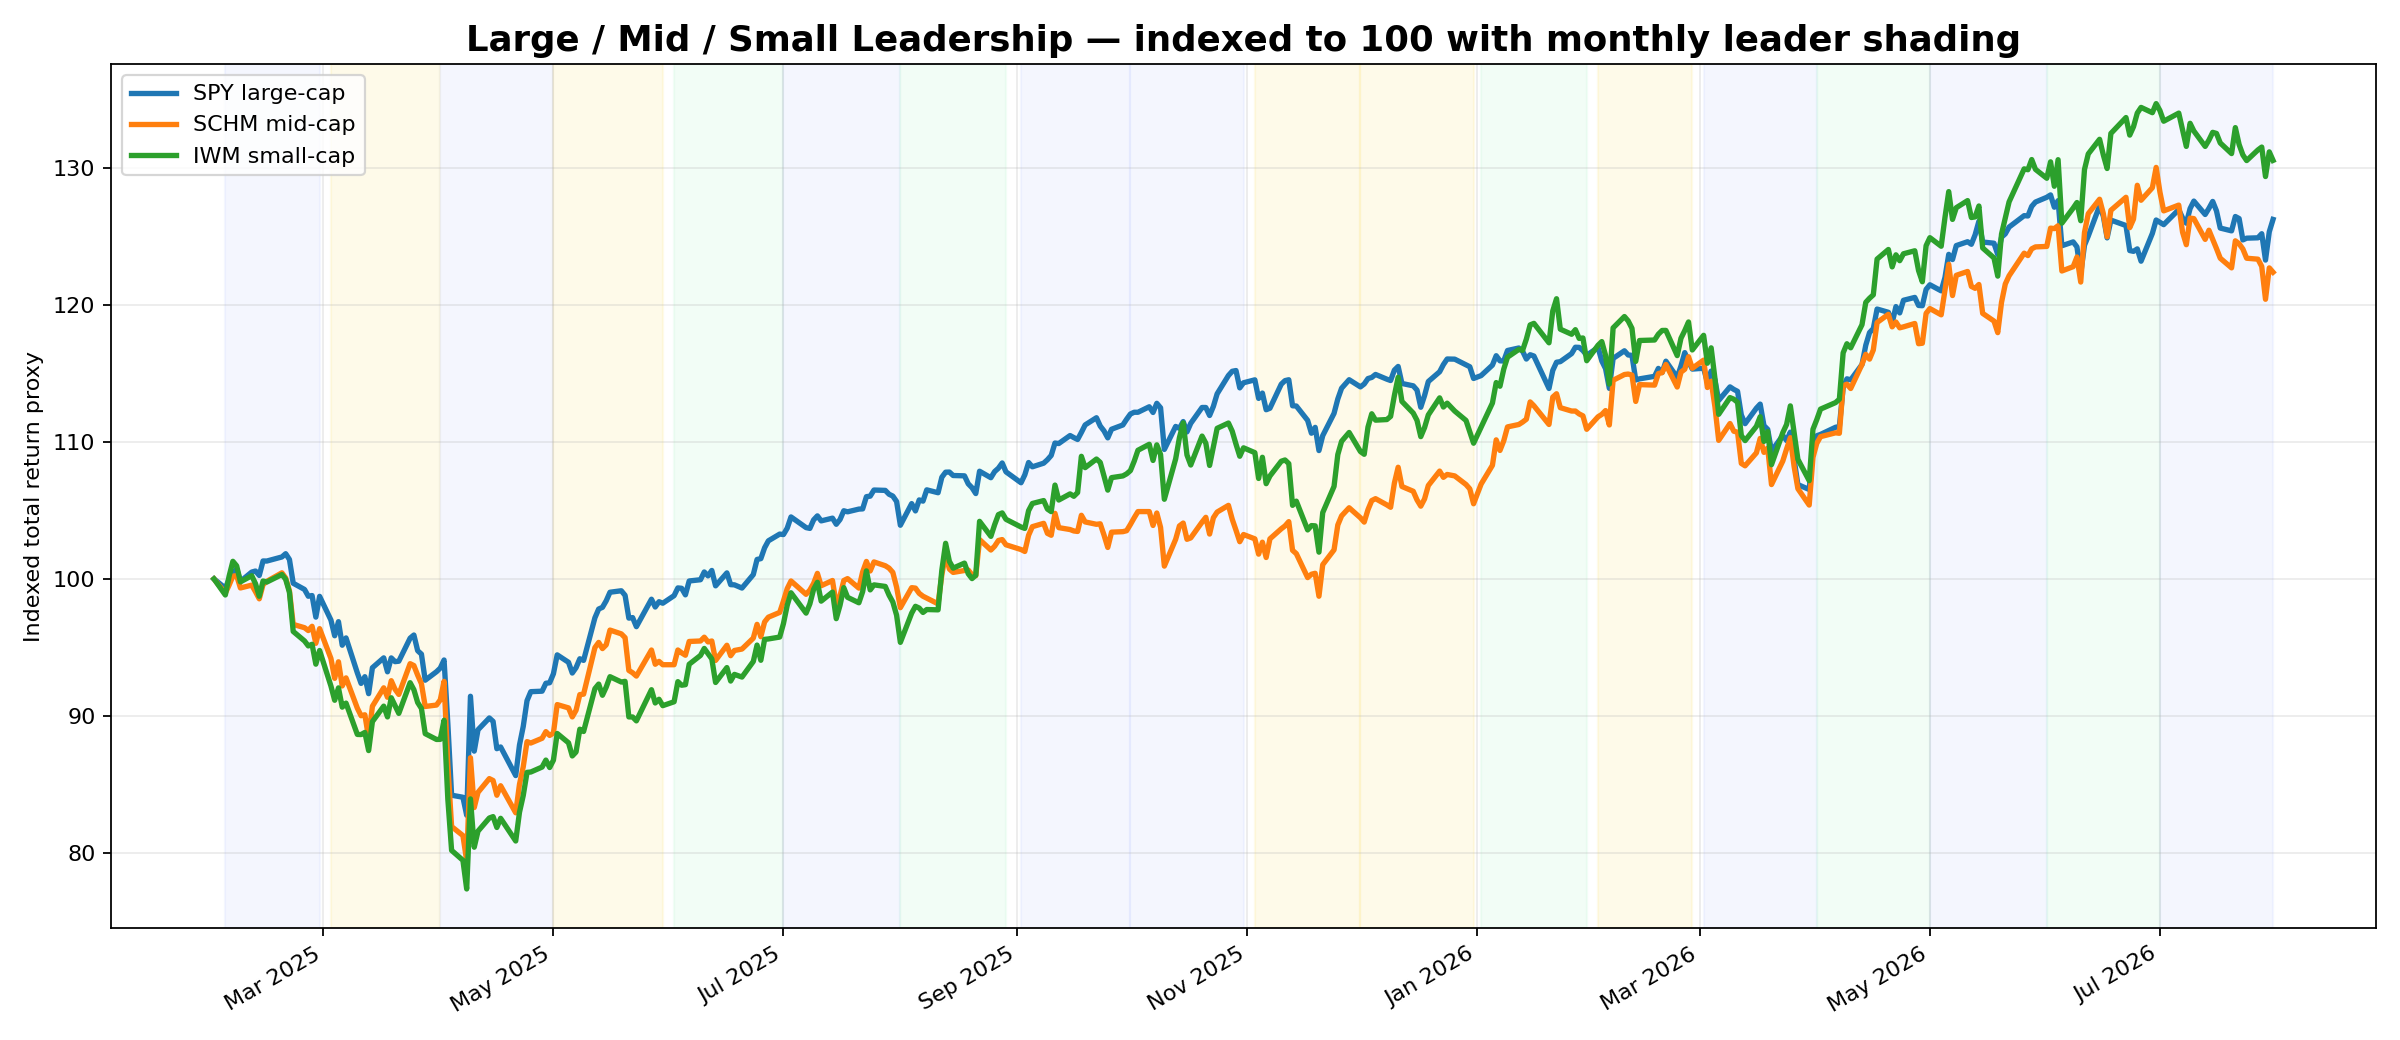
Market Leadership Digest
Savior’s Take: Size/style leadership has shifted from SCHM in last month to RSP month to date. Sector leadership has shifted from XLI in last month to XLE month to date. Potential emerging leadership: XOP, XLE. Potential fading leadership: SOXX, AI Semis, SMH.
Leadership Shift Notes
- Size/style leadership has shifted from SCHM in last month to RSP month to date.
- Sector leadership has shifted from XLI in last month to XLE month to date.
- Theme/subsector leadership has shifted from XBI in last month to KWEB month to date.
- Custom basket leadership has shifted from Obesity / GLP-1 in last month to Hyperscalers month to date.
- Size/style leadership has shifted from QQQ in last quarter to RSP quarter to date.
- Sector leadership has shifted from XLK in last quarter to XLE quarter to date.
- Theme/subsector leadership has shifted from SOXX in last quarter to KWEB quarter to date.
- Custom basket leadership has shifted from AI Semis in last quarter to Hyperscalers quarter to date.
Leadership by Time Window
| Period | Size / Style Leader | Sector Leader | Theme Leader | Basket Leader |
|---|---|---|---|---|
| Month to date | RSP +1.05% | XLE +12.13% | KWEB +16.43% | Hyperscalers +9.25% |
| Last month | SCHM +4.67% | XLI +7.25% | XBI +15.89% | Obesity / GLP-1 +6.86% |
| Quarter to date | RSP +1.05% | XLE +12.13% | KWEB +16.43% | Hyperscalers +9.25% |
| Last quarter | QQQ +27.73% | XLK +43.53% | SOXX +95.05% | AI Semis +101.20% |
| Year to date | IWM +18.79% | XLE +35.03% | SOXX +67.84% | AI Semis +73.05% |
| Last year | QQQ +20.77% | XLK +24.61% | GDX +154.77% | AI Semis +92.61% |
Current Leaders
| Name | Group | Last 5D | MTD | Last Month | QTD | Last Qtr | YTD | Last Year |
|---|---|---|---|---|---|---|---|---|
| XOP Oil & gas E&P |
Subsectors / Themes | +1.92% | +15.00% | -5.47% | +15.00% | -14.75% | +41.76% | -2.15% |
| XLE Energy |
Sectors | -0.12% | +12.13% | -4.97% | +12.13% | -12.68% | +35.03% | +7.88% |
| Hyperscalers MSFT, AMZN, GOOGL, META |
Custom Baskets | +10.92% | +9.25% | -11.48% | +9.25% | +9.58% | +3.15% | +24.97% |
| KWEB China internet |
Subsectors / Themes | +8.37% | +16.43% | -8.45% | +16.43% | -13.93% | -16.33% | +23.54% |
| SKYY Cloud computing |
Subsectors / Themes | +8.37% | +6.27% | -6.92% | +6.27% | +23.04% | +9.93% | +9.20% |
| Defense / Aerospace Leaders ITA, LMT, RTX, NOC, GD |
Custom Baskets | +0.03% | +8.38% | -0.36% | +8.38% | -5.36% | +12.64% | +33.31% |
Current Laggards
| Name | Group | Last 5D | MTD | Last Month | QTD | Last Qtr | YTD | Last Year |
|---|---|---|---|---|---|---|---|---|
| REMX Rare earth / strategic metals |
Subsectors / Themes | -2.28% | -25.46% | -11.17% | -25.46% | +0.57% | -10.75% | +92.95% |
| XHB Homebuilders |
Subsectors / Themes | -4.38% | -10.27% | +12.76% | -10.27% | +17.23% | +1.16% | -0.69% |
| IWF Russell 1000 growth |
Size / Style | +0.57% | -4.71% | -2.79% | -4.71% | +16.58% | +0.17% | +18.33% |
| Obesity / GLP-1 LLY, NVO |
Custom Baskets | -3.71% | -3.01% | +6.86% | -3.01% | +30.54% | +1.59% | +0.51% |
| IBIT Bitcoin ETF |
Subsectors / Themes | -1.95% | +7.06% | -20.03% | +7.06% | -13.35% | -28.22% | -6.41% |
| XLU Utilities |
Sectors | -4.19% | -2.18% | +2.72% | -2.18% | -0.57% | +5.28% | +16.02% |
Rotation Watch: Emerging and Fading Leadership
| Name | Group | Last 5D | MTD | Last Month | QTD | Last Qtr | YTD | Last Year | Why watch |
|---|---|---|---|---|---|---|---|---|---|
| XOP Oil & gas E&P |
Subsectors / Themes | +1.92% | +15.00% | -5.47% | +15.00% | -14.75% | +41.76% | -2.15% | MTD improving versus last month by +20.47%. QTD improving versus last quarter by +29.75%. YTD improving versus last year by +43.91%. |
| XLE Energy |
Sectors | -0.12% | +12.13% | -4.97% | +12.13% | -12.68% | +35.03% | +7.88% | MTD improving versus last month by +17.09%. QTD improving versus last quarter by +24.80%. YTD improving versus last year by +27.15%. |
| SOXX Semiconductors broad |
Subsectors / Themes | -4.20% | -21.20% | +12.65% | -21.20% | +95.05% | +67.84% | +40.74% | MTD weakening versus last month by -33.85%. QTD weakening versus last quarter by -116.26%. YTD improving versus last year by +27.10%. |
| AI Semis NVDA, AVGO, AMD, MU, TSM |
Custom Baskets | -4.04% | -11.74% | +5.08% | -11.74% | +101.20% | +73.05% | +92.61% | MTD weakening versus last month by -16.82%. QTD weakening versus last quarter by -112.93%. YTD weakening versus last year by -19.56%. |
| SMH Semiconductors |
Subsectors / Themes | -3.68% | -17.59% | +9.51% | -17.59% | +71.07% | +50.09% | +49.17% | MTD weakening versus last month by -27.10%. QTD weakening versus last quarter by -88.66%. Weak last 5D move of -3.68%. |
| REMX Rare earth / strategic metals |
Subsectors / Themes | -2.28% | -25.46% | -11.17% | -25.46% | +0.57% | -10.75% | +92.95% | MTD weakening versus last month by -14.29%. QTD weakening versus last quarter by -26.03%. YTD weakening versus last year by -103.70%. |
| XBI Biotech equal-weight |
Subsectors / Themes | -2.31% | -7.10% | +15.89% | -7.10% | +24.02% | +20.69% | +35.89% | MTD weakening versus last month by -22.99%. QTD weakening versus last quarter by -31.12%. YTD weakening versus last year by -15.21%. |
What We’re Watching
- Whether month-to-date leaders confirm or reverse last month’s leaders.
- Whether quarter-to-date leaders are broadening or merely extending last quarter’s winners.
- Whether year-to-date leaders are different from last year’s leaders, which would suggest a possible regime shift.
- Whether SCHM and IWM begin outperforming SPY consistently instead of only for brief bursts.
- Whether sector leadership rotates from growth/tech/discretionary toward defensives, cyclicals, financials, materials, energy, utilities, or health care.
Returns are gross period returns, not annualized. ETF, sector, subsector, and custom-basket returns are leadership proxies. Custom baskets are equal-weight approximations, not investable indexes. This is educational commentary only and not investment advice.
View the Market Leadership Dashboard →
SPY Technical Snapshot
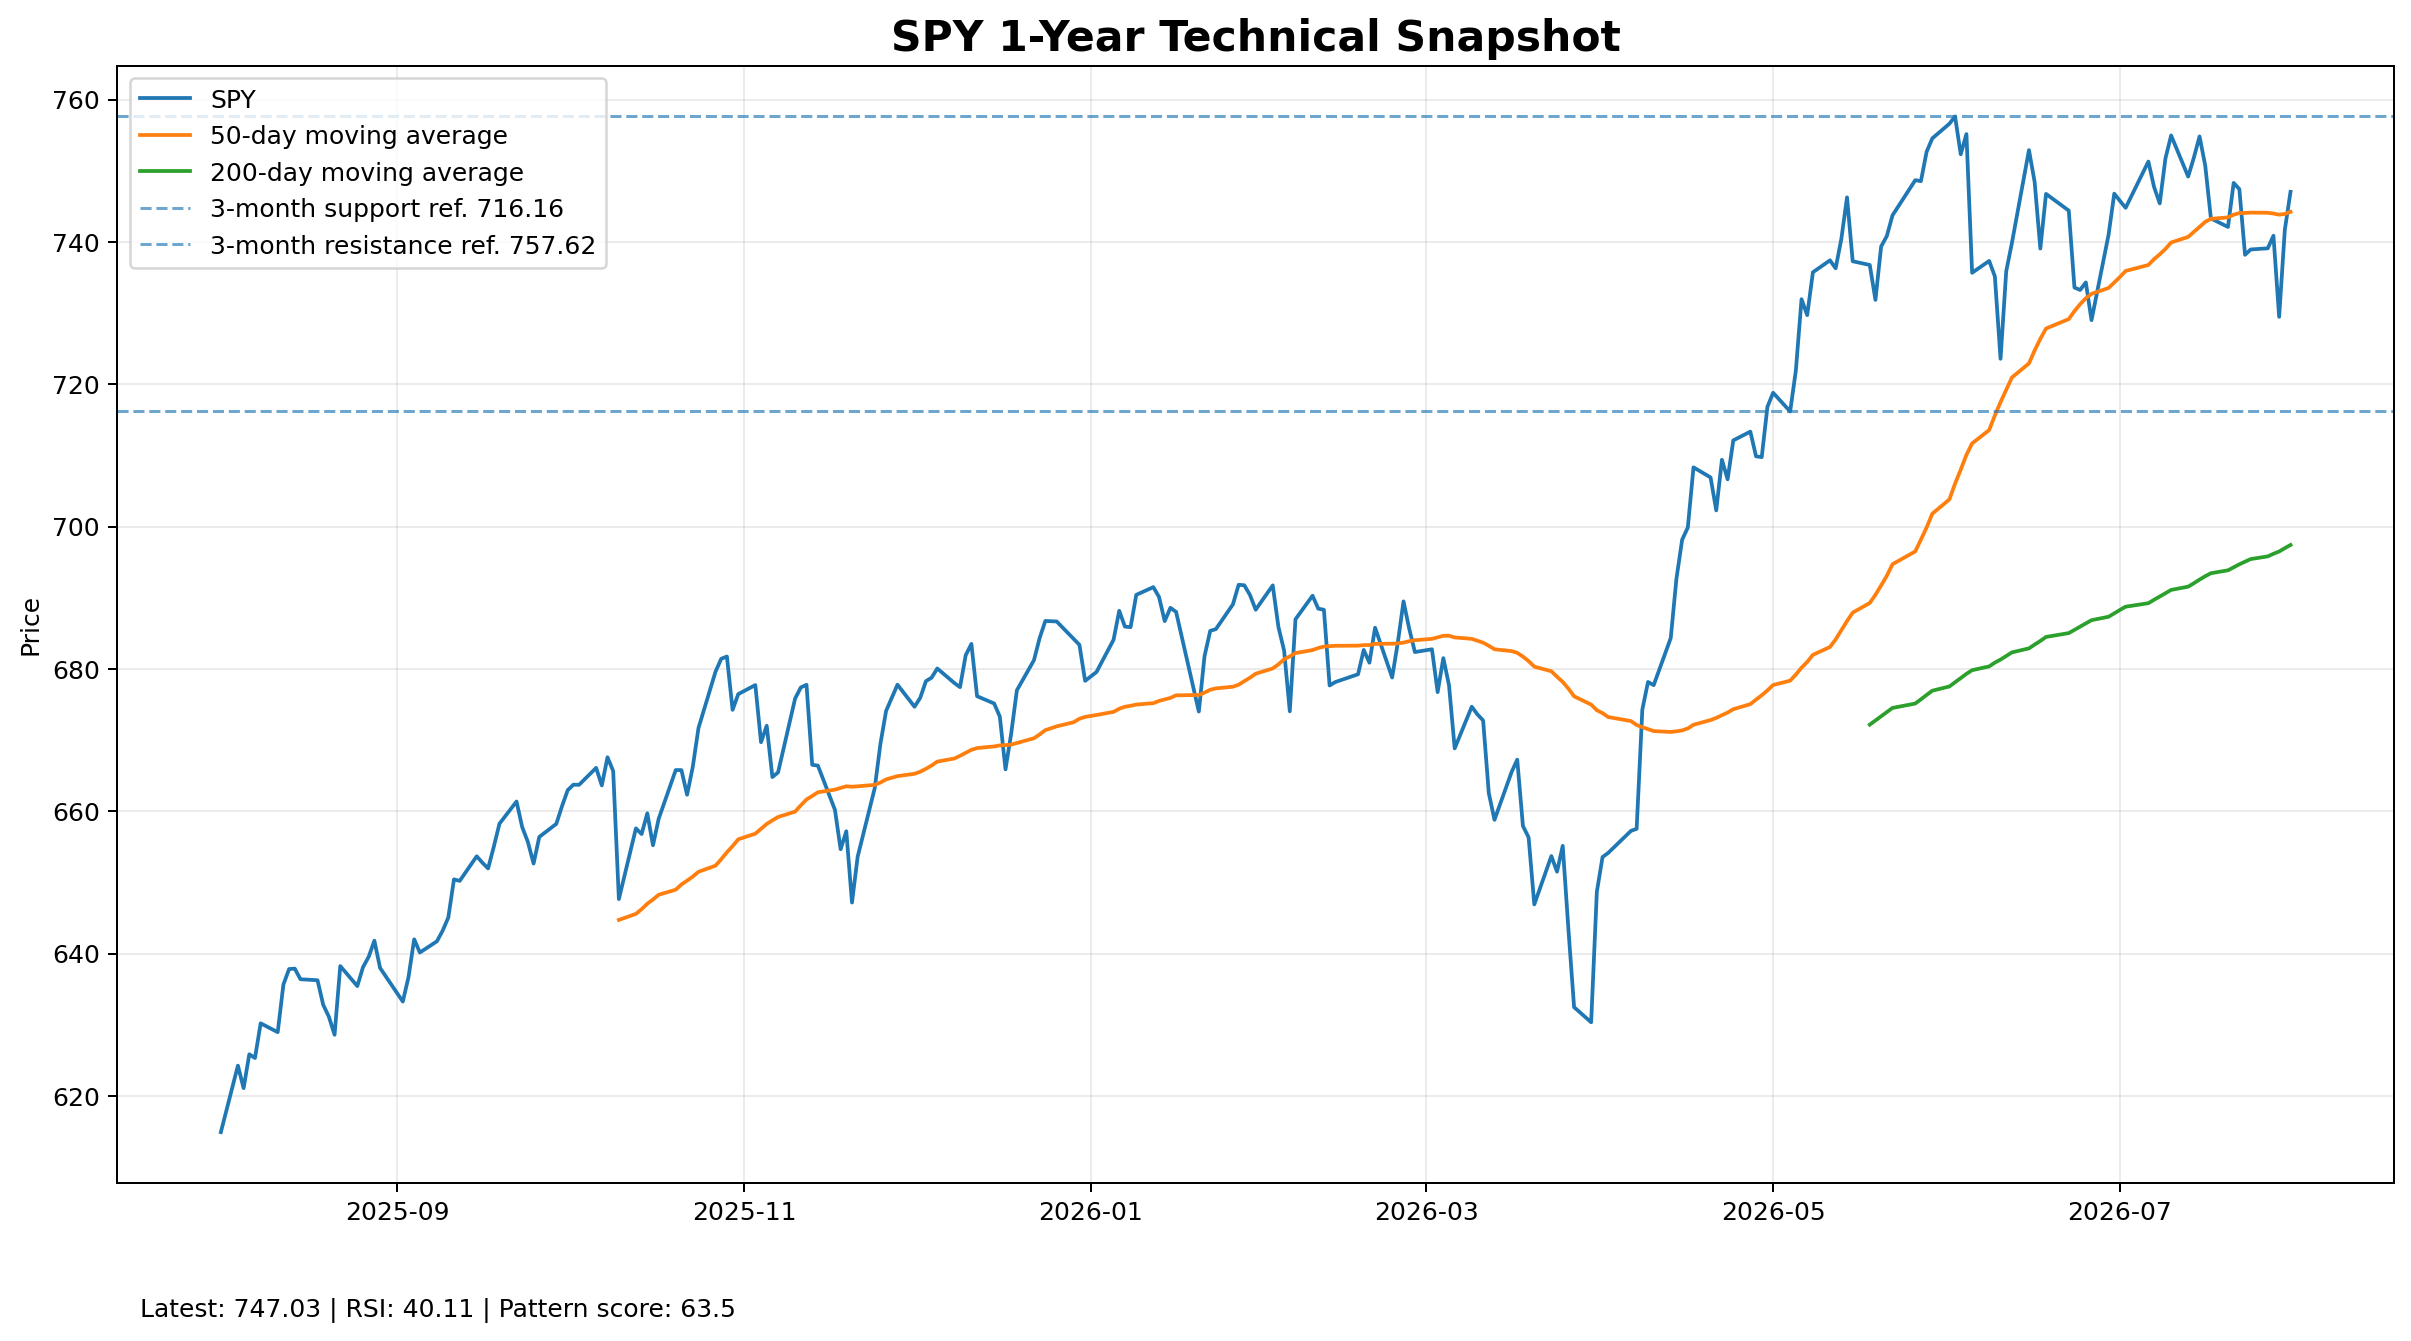
SPY is the main price picture of the market. This section embeds a public 1-year SPY chart and the current Pattern Lab summary directly on this page.
SPY
SPY is the primary S&P 500 ETF proxy used to visualize the market’s price trend.
Savior’s Take: SPY is technically constructive, but not fully confirmed. The setup becomes more interesting if price clears resistance, holds the breakout or retest, and volume improves.
Technical Read
SPY has a mixed technical read. The chart needs confirmation from price, support/resistance, and volume. RSI near 40.1 is not extreme, so support/resistance behavior matters more than overbought or oversold readings. What to watch: Watch the nearest practical support and resistance levels — support near 734.19, resistance near 751.79, breakdown reference near 733.34. The setup improves if price holds support and pushes through resistance; it weakens if support breaks. Pattern education: mixed setups require patience. Let support, resistance, volume, and trend behavior decide the next read.
How to Read the Timeframes
How to read the two timeframes 1-year daily chart: useful for tactical pattern confirmation, recent support/resistance, volume behavior, and whether buyers are defending the current setup. 3-year weekly chart: useful for the bigger intermediate trend, major support/resistance zones, prior bases, and whether the current move is noise or a larger structural change. Current weekly read: SPY has a mixed intermediate read; the next signal should come from support/resistance behavior and volume. What to watch: watch the practical support/resistance map — support near 734.19, resistance near 751.79, breakdown reference near 733.34. The longer moving average remains close enough to matter as a trend reference.
Charts of the Week
Pattern Lab scans the Popular Patterns universe and leadership data to select several charts that help explain current market structure.
| Symbol | Role | Links |
|---|---|---|
| SKYY | Continuation | PLPP · Yahoo |
| XLE | Decision | PLPP · Yahoo |
| REMX | Risk | PLPP · Yahoo |
| XOP | Rotation | PLPP · Yahoo |
How to Read This Dashboard
- Returns are gross period returns, not annualized.
- Top 50 vs. Bottom 450 helps show whether mega-cap concentration or broader participation is driving the market.
- SPY vs. RSP helps show whether the cap-weighted index is being confirmed by the average S&P 500 stock.
- SCHM and IWM help monitor whether mid caps and small caps are beginning to participate.
- Sector, subsector, and basket leadership helps identify whether leadership is still growth/technology-led or rotating into other areas.
Important disclosure: Educational commentary only. This material is not investment advice and is not a recommendation to buy or sell any security. Market-cap attribution, leadership groups, technical pattern scores, and custom baskets are research aids and may differ from official index calculations. Past performance does not guarantee future results.