
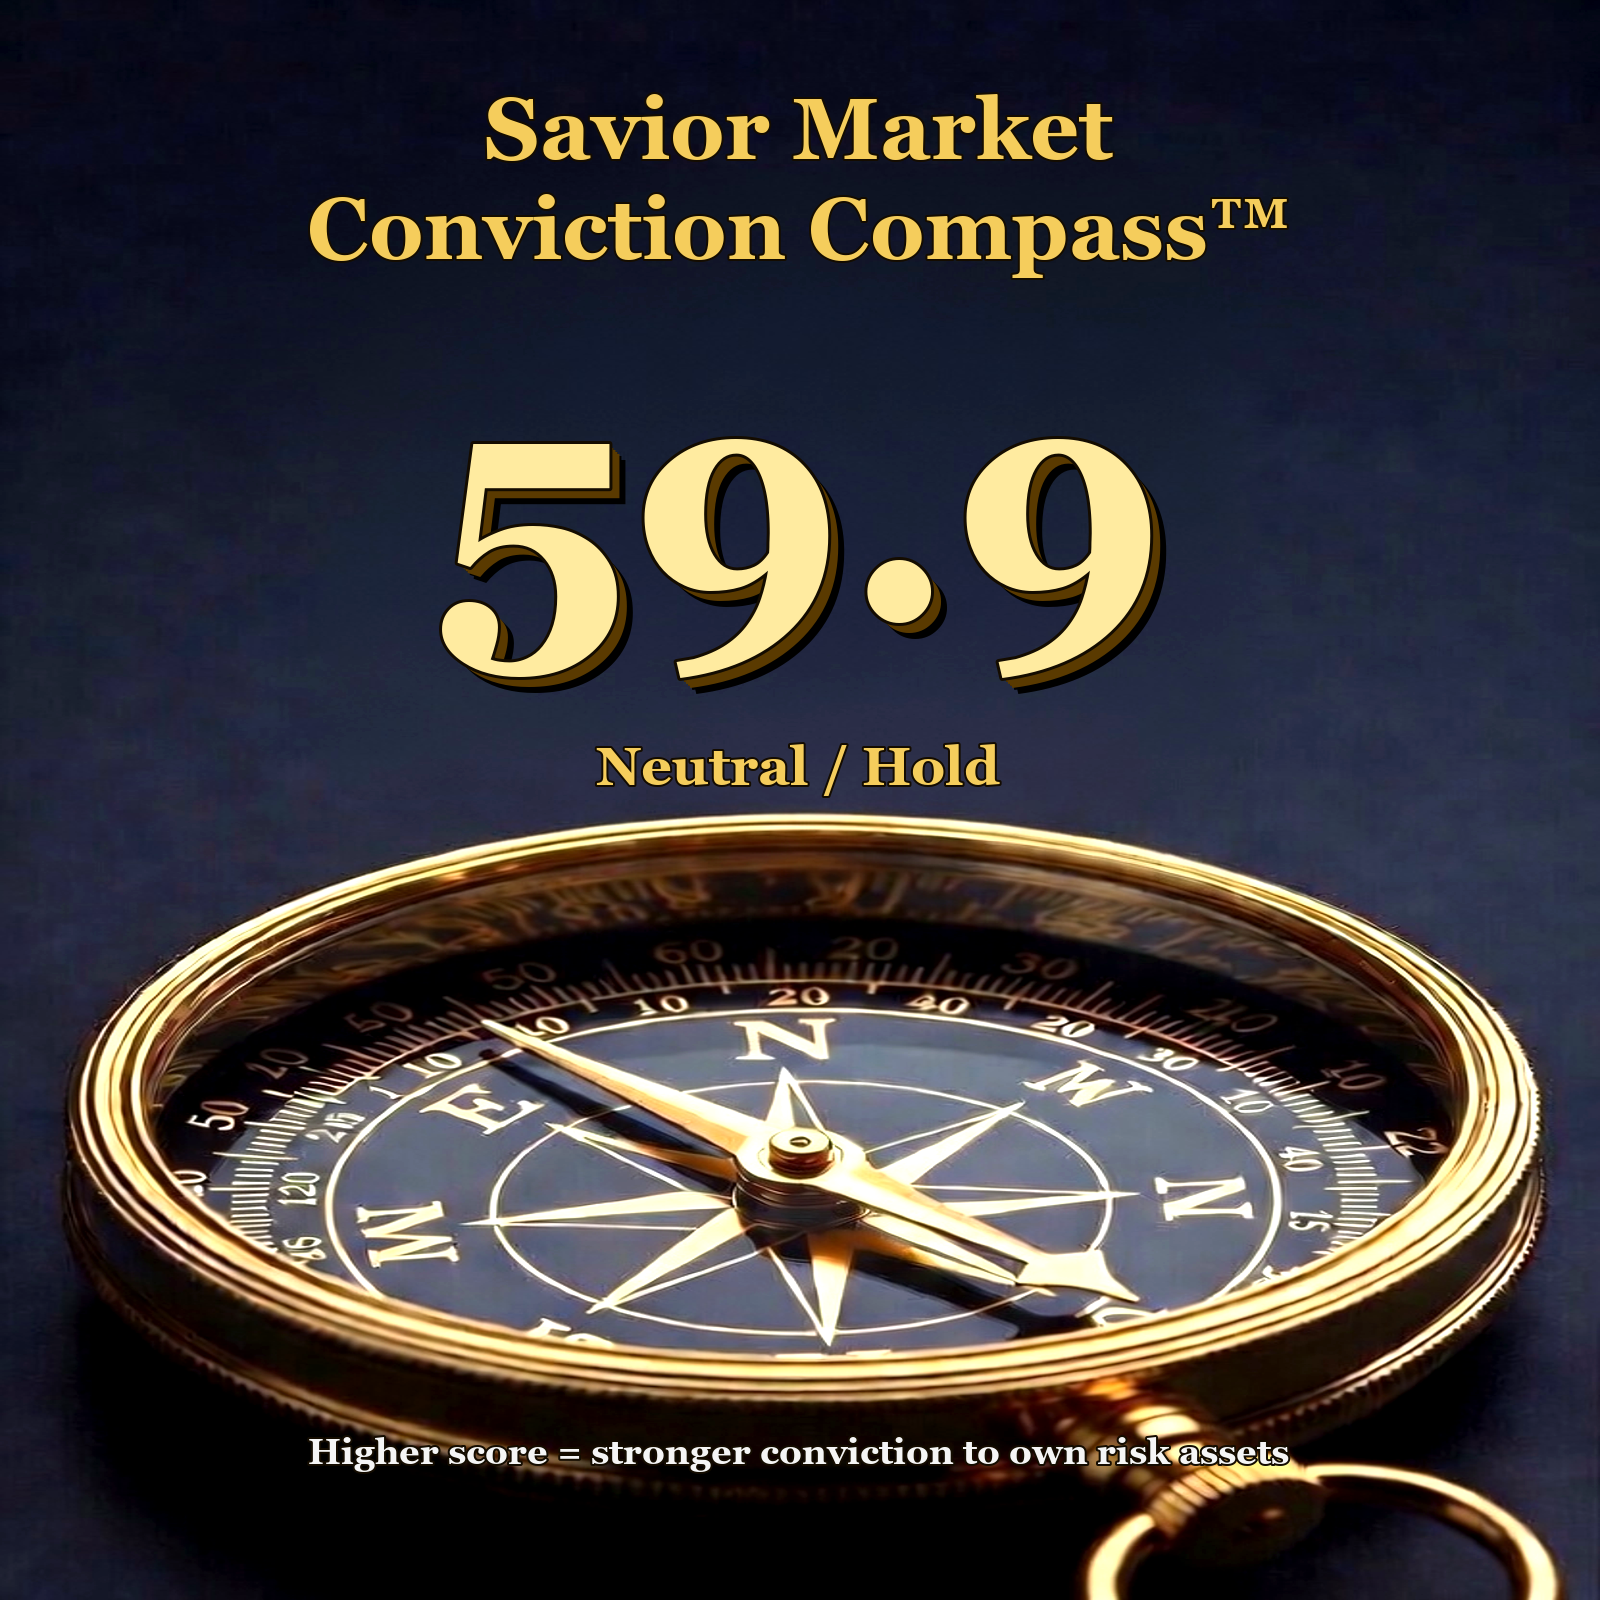
WEEK ENDING JULY 31, 2026
59.9/100 — Neutral / Hold
Prior week 59.0/100
Weekly change +0.9 points
Megacap leadership led
Market conviction is neutral. Maintain discipline and monitor confirmation signals.
Jump to the Detailed Compass Review
View the Live Daily Dashboard
Weekly Highlights
What improved or remained supportive
- Credit remained calm. High-yield credit returned +0.32% and investment-grade credit returned +0.02%, so credit markets did not confirm broad stress.
What deteriorated or needs confirmation
- Leadership remained concentrated despite positive participation. Advancers outnumbered decliners 243 to 174, but cap weight returned +2.42% versus +0.82% for equal weight—a 1.60 percentage-point advantage. The top 50 contributed +2.386 points while the bottom 450 added +0.033 points. The largest companies drove most of the advance.
- Treasury yields rose. The 10-year Treasury yield increased 6.6 basis points, maintaining pressure on duration-sensitive assets.
New Research and Articles
Market Structure Return Quilt
See how leadership changed across the latest session, prior week, year to date, and longer market periods. The Return Quilt helps identify persistent leadership, improving participation, and potential rotation between asset classes.

The AI Capital Loop: How Hyperscaler Spending, Debt and Market Concentration Can Move Your Portfolio
What is a hyperscaler, how is the AI buildout being financed, and why is the Bank for International Settlements—the central bank for central banks—warning about debt, cash conversion, and concentration risk?
What Today’s Valuations Could Mean for the Next Decade
Is a 4% retirement withdrawal still enough if future returns are below average? See how today’s starting valuation and sequence risk can pressure a financial plan—even when valuation is not a short-term market clock.
What Moved the Market This Week
Market Movers estimates which companies drove the index-level move. Leadership remained concentrated despite positive participation. Advancers outnumbered decliners 243 to 174, but cap weight returned +2.42% versus +0.82% for equal weight—a 1.60 percentage-point advantage. The top 50 contributed +2.386 points while the bottom 450 added +0.033 points. The largest companies drove most of the advance.
Savior’s Take:
This was a top-heavy week. the top 50 contributed +2.386 percentage points, while the bottom 450 contributed +0.033 percentage points, which is technically positive but essentially flat. Because equal weight was +0.82%, the average stock did not confirm the strength in the largest names. The right read is concentrated leadership, not broad participation.
| Market-Cap Bucket | Rank Range | Contribution | What It Shows |
|---|---|---|---|
| Top 50 | 1-50 | +2.386 pts | Largest companies / headline index leadership |
| Next 50 | 51-100 | -0.077 pts | Large but less dominant companies |
| Next 100 | 101-200 | +0.037 pts | Middle of the index |
| Next 100 | 201-300 | +0.058 pts | Broader market participation |
| Final 200 | 301-end | +0.014 pts | Smallest S&P 500 constituents |
Read the Full Weekly Market Movers Review
Explore the Market Structure Dashboard
SPY Pattern Lab Snapshot
Pattern Score:
63.50 | Watch Priority:
65% | Latest Price:
741.74 | As of 2026-07-31
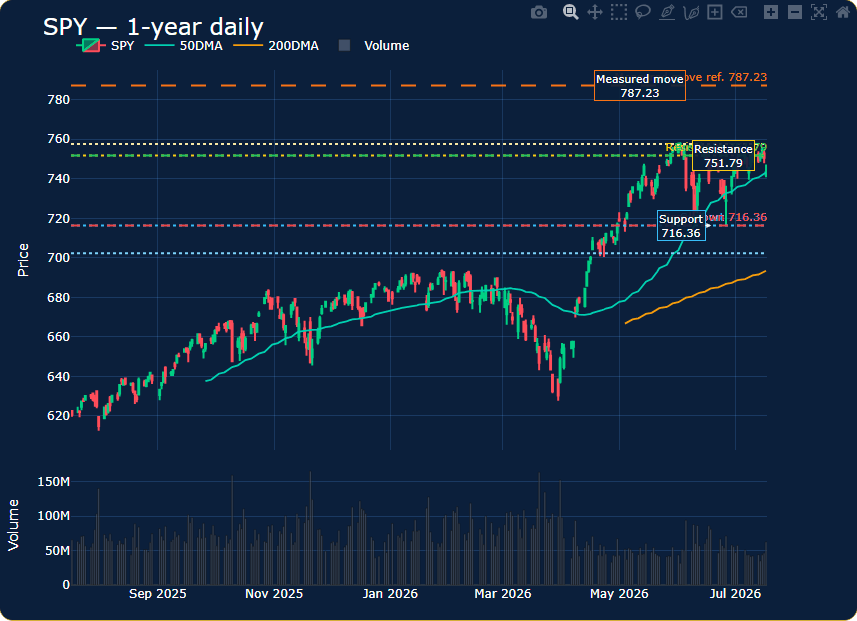
Pattern Lab read
Leadership / trend continuation watch
Setup: Constructive but volume unconfirmed
Compass alignment
SPY is technically constructive but not fully confirmed. A sustained break above resistance
would improve the setup; a loss of support would increase downside risk.
Volume: Recent volume does not confirm the bullish setup yet
What would improve: The setup would improve if SPY clears the resistance/breakout area near 751.9, holds the breakout or retest, and volume improves.
What would weaken: The setup would weaken if SPY loses the support/breakdown reference near 733.34, especially if breadth or volume also deteriorates.
Major Asset Class Snapshot
Daily returns are close-to-close; 10-year Treasury yield changes are shown in basis points. Green and red highlight relative strength and weakness; VIX and yield changes are interpreted inversely because lower readings are generally supportive.
| Asset | Latest | Mon | Tue | Wed | Thu | Fri | This Week | Prior Week | YTD |
|---|---|---|---|---|---|---|---|---|---|
| S&P 500SPY | 747.03 | +0.02% | +0.24% | -1.54% | +1.68% | +0.72% | +1.10% | -0.59% | +9.93% |
| Nasdaq 100QQQ | 687.99 | -0.31% | -0.97% | -2.04% | +3.30% | +0.65% | +0.55% | -1.60% | +12.48% |
| Developed InternationalEFA | 105.58 | +0.48% | -0.02% | -0.50% | +2.78% | -0.62% | +2.10% | +0.08% | +10.52% |
| Emerging MarketsEEM | 64.09 | +0.46% | -1.98% | -2.07% | +4.13% | +0.79% | +1.20% | +0.06% | +14.55% |
| Russell 2000IWM | 291.20 | +0.60% | +0.16% | -1.64% | +1.39% | -0.48% | +0.01% | -0.98% | +17.54% |
| U.S. Mid CapSCHM | 34.70 | -0.06% | -0.43% | -1.95% | +1.90% | -0.26% | -0.83% | +0.00% | +14.47% |
| Long-Term TreasuriesTLT | 82.25 | +0.60% | +0.59% | -1.65% | -0.06% | -0.66% | -1.20% | -1.50% | -3.35% |
| Core Aggregate BondsAGG | 97.37 | +0.24% | +0.24% | -0.38% | +0.07% | -0.26% | -0.09% | -0.75% | -0.53% |
| Intermediate TreasuriesIEF | 92.95 | +0.27% | +0.30% | -0.42% | +0.04% | -0.28% | -0.09% | -0.86% | -1.36% |
| 1-3 Month T-BillsBIL | 91.68 | +0.01% | +0.01% | +0.01% | +0.01% | +0.03% | +0.08% | +0.07% | +2.04% |
| High Yield CreditHYG | 79.48 | +0.05% | +0.19% | -0.23% | +0.29% | +0.01% | +0.32% | -0.53% | +1.49% |
| High Yield CreditJNK | 95.68 | +0.07% | +0.16% | -0.23% | +0.28% | +0.02% | +0.30% | -0.61% | +1.70% |
| Investment Grade CreditLQD | 106.25 | +0.26% | +0.30% | -0.57% | +0.18% | -0.15% | +0.02% | -1.24% | -1.36% |
| GoldGLD | 371.54 | +0.73% | -1.40% | +0.46% | +1.64% | -1.49% | -0.10% | +0.95% | -6.71% |
| SilverSLV | 52.36 | +0.65% | -2.32% | +0.14% | +3.34% | -2.13% | -0.44% | +3.56% | -20.37% |
| WTI Crude OilCL=F | 84.71 | -7.50% | -4.06% | +6.56% | -1.03% | +1.34% | -5.15% | +8.27% | +47.78% |
| U.S. Dollar IndexDX-Y.NYB | 99.79 | +0.04% | -0.13% | -0.57% | -0.78% | -0.22% | -1.66% | +0.71% | +1.39% |
| Cboe Volatility Index^VIX | 15.99 | +0.48% | -2.46% | +13.45% | -17.28% | -6.44% | -13.94% | -1.01% | +10.20% |
| 10-Year Treasury YieldDGS10 | 4.74% | -4 bp | -4 bp | +2 bp | +4 bp | +8 bp | +7 bp | +14 bp | +49 bp |
Weekly Asset Leadership and Rotation
Weekly leadership was strongest in EFA (+2.10%), EEM (+1.20%), SPY (+1.10%), while the weakest areas were CL=F (-5.15%), DX-Y.NYB (-1.66%), TLT (-1.20%). Large-cap and growth proxies outperformed mid- and small-cap proxies, showing that leadership remained comparatively concentrated. These relative moves help identify where capital is rotating, but they are monitoring evidence—not stand-alone instructions to buy, trim, or sell.
The individual asset names in the table link to their approved public evergreen research pages when one is available. Those reports provide the technical, volume, support/resistance, valuation, or market-structure context behind the weekly comparison.
Rates, Bonds, and Credit
The 10-year Treasury changed +7 bp for the week and finished near 4.74%. Longer-term yields rose and duration-sensitive bonds weakened: TLT returned -1.20%, AGG returned -0.09%, and BIL returned +0.08%.
At the same time, high-yield OAS was 2.84% and investment-grade OAS was 0.80%. Those still-contained spreads indicate that credit markets were not confirming a broad funding breakdown. The combination matters: weak duration with still-contained credit spreads points more toward interest-rate pressure than a broad funding breakdown. A more defensive signal would require yields, credit spreads, funding conditions, breadth, and volatility to deteriorate together.
This is an educational risk map for duration, credit, liquidity, and portfolio-construction decisions—not a recommendation to buy or sell a bond or fund.
Bonds & Interest Rates DashboardTNX + AGG Bond Market ReportFixed Income & Credit Dashboard
Significant Weekly Asset Moves
Only moves greater than 2.5% appear here. The return is the starting point; the economic and portfolio implication is the reason it matters.
-13.94%
Why it matters: The move is large enough to affect cross-asset leadership and should be read with trend, liquidity, inflation, and portfolio-risk evidence.
-5.15%
Why it matters: Falling oil can ease inflation pressure, although it may also reflect softer expectations for global demand.
Breadth, Leadership, Sectors, Subsectors, and Rotation
Weekly Savior’s Take: Megacap leadership led. Leadership remained concentrated despite positive participation. Advancers outnumbered decliners 243 to 174, but cap weight returned +2.42% versus +0.82% for equal weight—a 1.60 percentage-point advantage. The top 50 contributed +2.386 points while the bottom 450 added +0.033 points. The largest companies drove most of the advance. The Friday-close sector map showed relative strength in Consumer Discretionary, Communication Services, Energy, Industrials, Financials and relative weakness in Materials, Utilities, Health Care, Real Estate, Consumer Staples. Those sector and subsector readings describe the close-of-week confirmation layer; the full-week return comparison comes from the Asset Evergreen and Weekly Market Movers contracts. Weekly leadership was strongest in EFA (+2.10%), EEM (+1.20%), SPY (+1.10%), while the weakest areas were CL=F (-5.15%), DX-Y.NYB (-1.66%), TLT (-1.20%). Large-cap and growth proxies outperformed mid- and small-cap proxies, showing that leadership remained comparatively concentrated. These relative moves help identify where capital is rotating, but they are monitoring evidence—not stand-alone instructions to buy, trim, or sell.
Sector Leaders
- XLY Consumer Discretionary+3.29%
- XLC Communication Services+1.56%
- XLE Energy+1.00%
- XLI Industrials+0.81%
- XLF Financials-0.11%
Sector Laggards
- XLB Materials-2.34%
- XLU Utilities-0.69%
- XLV Health Care-0.59%
- XLRE Real Estate-0.51%
- XLP Consumer Staples-0.49%
Subsector / Theme Leaders
- OIH Oil Services+2.39%
- CIBR Cybersecurity+2.01%
- GRID Power Grid / Infrastructure+1.53%
- KWEB China Internet+1.53%
- XOP Oil & Gas Exploration+1.45%
Subsector / Theme Laggards
- GDXJ Junior Gold Miners-3.69%
- GDX Gold Miners-3.49%
- XBI Biotech Equal Weight-2.94%
- ARKK Innovation / High Beta Growth-2.28%
- IBB Biotech Large Cap-1.87%
Cross-Asset Leaders
- BNO Brent Oil+1.45%
- USO Oil+1.33%
- UNG Natural Gas+0.50%
- DBC Broad Commodities+0.44%
- FXY Japanese Yen+0.14%
Cross-Asset Laggards
- WEAT Wheat-3.29%
- ETH-USD Ethereum-3.02%
- BTC-USD Bitcoin-2.87%
- SLV Silver-2.13%
- GLD Gold-1.49%
Sector and subsector boxes use the Friday-close Market Structure event map; commodities and cross-asset proxies remain separate from sectors.
Dashboard Group and Public Indicator Trends
The Weekly Compass combines eight areas of market evidence. The public review below explains what each area is showing, how it is trending, why it matters historically, and what would improve or weaken it.
Dashboard Area Trends
| Dashboard Area | Current Read | Trend Read | Plain-English Interpretation |
|---|---|---|---|
| Breadth & Structure | Supportive | Stable | Participation improved as the average stock and smaller-company proxies held up better than the cap-weighted headline, although technology breadth still needs confirmation. |
| Price Trend & Technicals | Mixed | Stable | Momentum weakened sharply: weekly MACD and SPY/QQQ RSI deteriorated. The market remains above its long-term trend, but near-term technical conviction fell. |
| Volatility / Dealer / Options | Strong support | Stable | Volatility and dealer positioning remain relatively contained. That helps absorb stress, but calm volatility should not be mistaken for an all-clear. |
| Credit & Funding | Strong support | Stable | Corporate credit spreads remain contained and funding markets are functioning normally. Rapid spread widening would be an important early warning. |
| Sentiment & Hedging | Watch | Stable | Sentiment and hedging signals remain mixed: caution is visible, while crowded positioning leaves the market sensitive to a change in trend. |
| Leverage / Fragility | Watch | Stable | Leverage remains a longer-term vulnerability. High margin-debt growth can amplify losses if volatility rises or collateral values fall. |
| Macro / Rates / Policy | Supportive | Stable | Treasury yields rose and the curve flattened modestly, increasing the hurdle for long-duration assets and keeping rates an important swing factor. |
| Valuation / Fundamentals | Structural pressure | Stable | Valuations remain historically elevated. This does not time the next decline, but it narrows the margin for error and raises long-horizon return risk. |
Detailed Group and Indicator Review
Breadth & Structure
Supportive
Stable
Why it matters: Breadth asks whether gains are supported by many stocks or depend on a narrow group. Broader participation generally makes a trend more durable.
Current read: Participation improved as the average stock and smaller-company proxies held up better than the cap-weighted headline, although technology breadth still needs confirmation.
Historical context: Healthy advances usually show broad participation across short- and long-term trend measures. Narrow leadership can persist, but it leaves the index more sensitive to a few large companies.
Would improve: More stocks reclaim their 50- and 200-day averages, new highs expand, and advancing volume strengthens.
Would weaken: Participation narrows, new lows expand, or index gains continue while fewer stocks confirm.
| Indicator | Latest | Previous | Up / Down | 1 Yr Ago | Trend / Interpretation |
|---|---|---|---|---|---|
| SPX % Above 50DMAShare of S&P 500 stocks in an intermediate uptrend. | 62.7% | 62.5% | ↑ +0.20 pts | — | The reading rose from 62.5%. Short-term S&P 500 participation improved, suggesting the advance was not limited only to the largest names. A comparable one-year observation is not yet available in the versioned Compass history. |
| SPX % Above 200DMAShare of S&P 500 stocks above their long-term trend. | 68.5% | 68.5% | → Unchanged | — | The reading was essentially unchanged. Long-term participation softened. It remains broadly healthy, but continued erosion would weaken the market’s foundation. A comparable one-year observation is not yet available in the versioned Compass history. |
| NDX % Above 50DMABreadth inside the Nasdaq-100 and growth leadership. | 50.0% | 50.0% | → Unchanged | — | The reading was essentially unchanged. Nasdaq-100 participation weakened, showing that growth and technology leadership was less healthy beneath the headline. A comparable one-year observation is not yet available in the versioned Compass history. |
| NYSE A/D Trend ScoreWhether advancing issues are persistently outnumbering decliners. | 44.18 | 43.78 | ↑ +0.40 | — | The reading rose from 43.78. Advancing issues strengthened materially relative to decliners, supporting the week’s broader-participation message. A comparable one-year observation is not yet available in the versioned Compass history. |
| New Highs – New LowsNet balance of stocks making new highs versus new lows. | 2 | 2 | → Unchanged | — | The reading was essentially unchanged. Net balance of stocks making new highs versus new lows. A comparable one-year observation is not yet available in the versioned Compass history. |
| NYSE 90% Volume ScoreWhether upside or downside volume is becoming unusually one-sided. | 73.82 | 73.82 | → Unchanged | — | The reading was essentially unchanged. Whether upside or downside volume is becoming unusually one-sided. A comparable one-year observation is not yet available in the versioned Compass history. |
Price Trend & Technicals
Mixed
Stable
Why it matters: Trend measures whether price behavior is confirming or resisting the fundamental and macro backdrop.
Current read: Momentum weakened sharply: weekly MACD and SPY/QQQ RSI deteriorated. The market remains above its long-term trend, but near-term technical conviction fell.
Historical context: Sustained markets normally hold major moving averages and maintain positive intermediate momentum. Oversold readings can create rebounds without establishing a durable trend.
Would improve: SPY and QQQ momentum recover, weekly MACD turns positive, and price holds above important trend references.
Would weaken: Momentum rolls over, rallies fail at resistance, or price loses long-term trend support.
| Indicator | Latest | Previous | Up / Down | 1 Yr Ago | Trend / Interpretation |
|---|---|---|---|---|---|
| SPX Distance to 250DMA %How extended the S&P 500 is from its long-term trend. | 8.7% | 8.7% | → Unchanged | — | The reading was essentially unchanged. How extended the S&P 500 is from its long-term trend. A comparable one-year observation is not yet available in the versioned Compass history. |
| Weekly MACD SPXIntermediate momentum and direction of trend change. | -0.49 | -0.49 | → Unchanged | — | The reading was essentially unchanged. Intermediate momentum rolled over. Stabilization and a positive turn would improve technical confirmation. A comparable one-year observation is not yet available in the versioned Compass history. |
| SPY RSI 14DShort-term SPY momentum and overbought/oversold pressure. | 48.39 | 48.39 | → Unchanged | — | The reading was essentially unchanged. SPY momentum weakened toward a more cautious zone. A recovery would improve the short-term technical picture. A comparable one-year observation is not yet available in the versioned Compass history. |
| QQQ RSI 14DShort-term Nasdaq-100 momentum and growth-stock pressure. | 40.06 | 40.06 | → Unchanged | — | The reading was essentially unchanged. Nasdaq-100 momentum weakened more sharply, confirming pressure in growth leadership. A comparable one-year observation is not yet available in the versioned Compass history. |
Volatility / Dealer / Options
Strong support
Stable
Why it matters: Volatility and derivatives positioning show whether hedging demand and dealer flows are stabilizing or amplifying market moves.
Current read: Volatility and dealer positioning remain relatively contained. That helps absorb stress, but calm volatility should not be mistaken for an all-clear.
Historical context: Contained volatility and positive dealer positioning can cushion normal pullbacks. Rising volatility, weak liquidity, and adverse positioning can accelerate declines.
Would improve: VIX remains contained, market internals normalize, and options positioning supplies liquidity rather than forced selling.
Would weaken: VIX rises with deteriorating breadth, TRIN signals disorderly selling, or dealer positioning becomes destabilizing.
| Indicator | Latest | Previous | Up / Down | 1 Yr Ago | Trend / Interpretation |
|---|---|---|---|---|---|
| VIXOption-implied S&P 500 volatility and demand for protection. | 15.99 | 15.99 | → Unchanged | — | The reading was essentially unchanged. Implied volatility eased slightly and remains contained. A sharp rise would signal that investors are paying more for protection. A comparable one-year observation is not yet available in the versioned Compass history. |
| Dealer Gamma $bnEstimated dealer positioning that may dampen or amplify moves. | $8.0B | $8.0B | → Unchanged | — | The reading was essentially unchanged. Estimated dealer positioning that may dampen or amplify moves. A comparable one-year observation is not yet available in the versioned Compass history. |
| TRINBreadth and volume stress; elevated readings can indicate disorderly selling. | 1.34 | 1.34 | → Unchanged | — | The reading was essentially unchanged. Breadth and volume stress; elevated readings can indicate disorderly selling. A comparable one-year observation is not yet available in the versioned Compass history. |
| Options Notional $TScale of options exposure that can influence hedging flows. | $4.70T | $4.70T | → Unchanged | — | The reading was essentially unchanged. Scale of options exposure that can influence hedging flows. A comparable one-year observation is not yet available in the versioned Compass history. |
| Put/Call RatioRelative demand for downside protection versus upside participation. | 0.76 | 0.76 | → Unchanged | — | The reading was essentially unchanged. Relative demand for downside protection versus upside participation. A comparable one-year observation is not yet available in the versioned Compass history. |
Credit & Funding
Strong support
Stable
Why it matters: Credit is the financial system’s early-warning layer. Calm spreads suggest capital remains available; widening spreads indicate rising default and funding concern.
Current read: Corporate credit spreads remain contained and funding markets are functioning normally. Rapid spread widening would be an important early warning.
Historical context: Major equity stress is more dangerous when high-yield and investment-grade spreads widen together. Calm credit often distinguishes a normal equity pullback from systemic stress.
Would improve: High-yield and investment-grade spreads remain tight, funding markets function normally, and liquidity stress stays low.
Would weaken: Credit spreads widen quickly, funding costs jump, or balance-sheet liquidity contracts.
| Indicator | Latest | Previous | Up / Down | 1 Yr Ago | Trend / Interpretation |
|---|---|---|---|---|---|
| High Yield OASExtra yield demanded from lower-quality corporate borrowers. | 2.84% | 2.84% | → Unchanged | — | The reading was essentially unchanged. Wider spreads mean lower-quality borrowers are paying more for financing. The increase was small and spreads remain contained, but acceleration would warn of rising credit stress. A comparable one-year observation is not yet available in the versioned Compass history. |
| Investment Grade OASExtra yield demanded from higher-quality corporate borrowers. | 0.80% | 0.80% | → Unchanged | — | The reading was essentially unchanged. The slight widening is not yet a stress signal. A persistent rise alongside high-yield spreads would be more concerning. A comparable one-year observation is not yet available in the versioned Compass history. |
| SOFRCore overnight funding rate for U.S. dollar markets. | 3.65% | 3.65% | → Unchanged | — | The reading was essentially unchanged. Core overnight funding rate for U.S. dollar markets. A comparable one-year observation is not yet available in the versioned Compass history. |
| Fed Balance SheetFederal Reserve liquidity footprint and balance-sheet direction. | $6.74T | $6.74T | → Unchanged | — | The reading was essentially unchanged. Federal Reserve liquidity footprint and balance-sheet direction. A comparable one-year observation is not yet available in the versioned Compass history. |
| Funding Stress ProxyComposite gauge of strain in short-term financing markets. | 6.72 | 6.72 | → Unchanged | — | The reading was essentially unchanged. Composite gauge of strain in short-term financing markets. A comparable one-year observation is not yet available in the versioned Compass history. |
Sentiment & Hedging
Watch
Stable
Why it matters: Sentiment measures how much optimism, fear, and hedging may already be reflected in prices.
Current read: Sentiment and hedging signals remain mixed: caution is visible, while crowded positioning leaves the market sensitive to a change in trend.
Historical context: Extreme optimism can leave little marginal buying power, while extreme fear can create tactical opportunity. Sentiment works best with trend and breadth confirmation.
Would improve: Positioning becomes less crowded and fear stabilizes without a breakdown in trend or credit.
Would weaken: Crowded positioning persists while price and breadth deteriorate, or hedging costs signal rising tail risk.
| Indicator | Latest | Previous | Up / Down | 1 Yr Ago | Trend / Interpretation |
|---|---|---|---|---|---|
| Fear & GreedComposite investor sentiment from fear to optimism. | 34 | 34 | → Unchanged | — | The reading was essentially unchanged. Composite investor sentiment from fear to optimism. A comparable one-year observation is not yet available in the versioned Compass history. |
| 25D SkewRelative cost of downside protection and perceived tail risk. | 148.7 | 148.7 | → Unchanged | — | The reading was essentially unchanged. Relative cost of downside protection and perceived tail risk. A comparable one-year observation is not yet available in the versioned Compass history. |
| CTA Positioning ScoreEstimated systematic trend-follower positioning and crowding. | 87.62 | 87.62 | → Unchanged | — | The reading was essentially unchanged. Estimated systematic trend-follower positioning and crowding. A comparable one-year observation is not yet available in the versioned Compass history. |
| CDX IG bpsInvestment-grade credit-derivative spread and corporate risk perception. | 75 | 75 | → Unchanged | — | The reading was essentially unchanged. Investment-grade credit-derivative spread and corporate risk perception. A comparable one-year observation is not yet available in the versioned Compass history. |
Leverage / Fragility
Watch
Stable
Why it matters: Leverage increases sensitivity to price declines, margin calls, refinancing needs, and forced deleveraging.
Current read: Leverage remains a longer-term vulnerability. High margin-debt growth can amplify losses if volatility rises or collateral values fall.
Historical context: High leverage does not time a correction, but it can magnify one when liquidity and trend weaken together.
Would improve: Leverage growth slows, financing remains available, and forced-selling risk declines.
Would weaken: Margin debt accelerates, collateral values fall, or tighter financing turns voluntary risk reduction into forced selling.
| Indicator | Latest | Previous | Up / Down | 1 Yr Ago | Trend / Interpretation |
|---|---|---|---|---|---|
| Margin Debt $bnBorrowed capital used to finance securities positions. | $1,304.3B | $1,304.3B | → Unchanged | — | The reading was essentially unchanged. Borrowed capital used to finance securities positions. A comparable one-year observation is not yet available in the versioned Compass history. |
| Margin Debt YoY %Speed at which securities leverage is expanding or contracting. | 53.3% | 53.3% | → Unchanged | — | The reading was essentially unchanged. Rapid leverage growth can magnify both gains and losses; a reversal during market weakness can intensify forced selling. A comparable one-year observation is not yet available in the versioned Compass history. |
| SBL $TSecurities-based lending exposure tied to portfolio collateral. | $1.11T | $1.11T | → Unchanged | — | The reading was essentially unchanged. Securities-based lending exposure tied to portfolio collateral. A comparable one-year observation is not yet available in the versioned Compass history. |
| Total Leverage $TCombined leverage estimate across monitored channels. | $7.12T | $7.12T | → Unchanged | — | The reading was essentially unchanged. Combined leverage estimate across monitored channels. A comparable one-year observation is not yet available in the versioned Compass history. |
| Total Leverage % GDPLeverage relative to the size of the economy. | 31.7 | 31.7 | → Unchanged | — | The reading was essentially unchanged. Leverage relative to the size of the economy. A comparable one-year observation is not yet available in the versioned Compass history. |
Macro / Rates / Policy
Supportive
Stable
Why it matters: Rates and policy influence discount rates, financing costs, currencies, housing, and the relative appeal of risk assets.
Current read: Treasury yields rose and the curve flattened modestly, increasing the hurdle for long-duration assets and keeping rates an important swing factor.
Historical context: Markets can tolerate higher rates when growth and earnings compensate. Rapid rate changes or policy uncertainty create more pressure than a stable level alone.
Would improve: Rates stabilize, the curve normalizes without recession stress, and policy becomes more predictable.
Would weaken: Real or nominal yields rise abruptly, inflation pressure returns, or policy uncertainty tightens financial conditions.
| Indicator | Latest | Previous | Up / Down | 1 Yr Ago | Trend / Interpretation |
|---|---|---|---|---|---|
| 10Y Treasury YieldLong-term risk-free rate used in valuations and financing. | 4.68% | 4.68% | → Unchanged | — | The reading was essentially unchanged. The higher long-term yield raises discount rates and borrowing costs, a headwind for bonds and richly valued long-duration equities. A comparable one-year observation is not yet available in the versioned Compass history. |
| 2Y Treasury YieldMarket expectation for the near-term policy-rate path. | 4.23% | 4.23% | → Unchanged | — | The reading was essentially unchanged. The rise implies a firmer expected policy path and less immediate rate relief. A comparable one-year observation is not yet available in the versioned Compass history. |
| 2s10s CurveDifference between 10- and 2-year yields and the shape of the curve. | 0.45% | 0.45% | → Unchanged | — | The reading was essentially unchanged. The curve flattened modestly. Its direction helps frame expectations for growth, policy, and financial conditions. A comparable one-year observation is not yet available in the versioned Compass history. |
| Fed Policy Manual ScoreRules-based assessment of policy and financial conditions. | 66.71 | 66.71 | → Unchanged | — | The reading was essentially unchanged. Rules-based assessment of policy and financial conditions. A comparable one-year observation is not yet available in the versioned Compass history. |
Valuation / Fundamentals
Structural pressure
Stable
Why it matters: Valuation measures the price investors pay for earnings, sales, and economic output. It shapes long-term return expectations more reliably than short-term timing.
Current read: Valuations remain historically elevated. This does not time the next decline, but it narrows the margin for error and raises long-horizon return risk.
Historical context: Expensive markets can keep rising, but high starting valuations have historically left less room for disappointment and lower subsequent long-horizon returns.
Would improve: Earnings and sales grow faster than price, valuation multiples normalize, or economic output catches up with market value.
Would weaken: Prices rise faster than fundamentals, margins disappoint, or rates increase the return required from equities.
| Indicator | Latest | Previous | Up / Down | 1 Yr Ago | Trend / Interpretation |
|---|---|---|---|---|---|
| Buffett Indicator %U.S. corporate equity market value relative to GDP. | 218.1% | 218.1% | → Unchanged | — | The reading was essentially unchanged. The reading improved from its prior reference but remains historically elevated, signaling a thin long-term margin for error rather than a short-term clock. A comparable one-year observation is not yet available in the versioned Compass history. |
| CAPEPrice relative to ten years of inflation-adjusted earnings. | 41.37 | 41.37 | → Unchanged | — | The reading was essentially unchanged. CAPE eased slightly but remains elevated versus history, increasing dependence on earnings growth and sustained margins. A comparable one-year observation is not yet available in the versioned Compass history. |
| S&P 500 P/SPrice paid for each dollar of S&P 500 sales. | 3.74 | 3.74 | → Unchanged | — | The reading was essentially unchanged. Price-to-sales increased, meaning investors paid more for each dollar of revenue. A comparable one-year observation is not yet available in the versioned Compass history. |
Longer-Term Valuation and Structural Risk
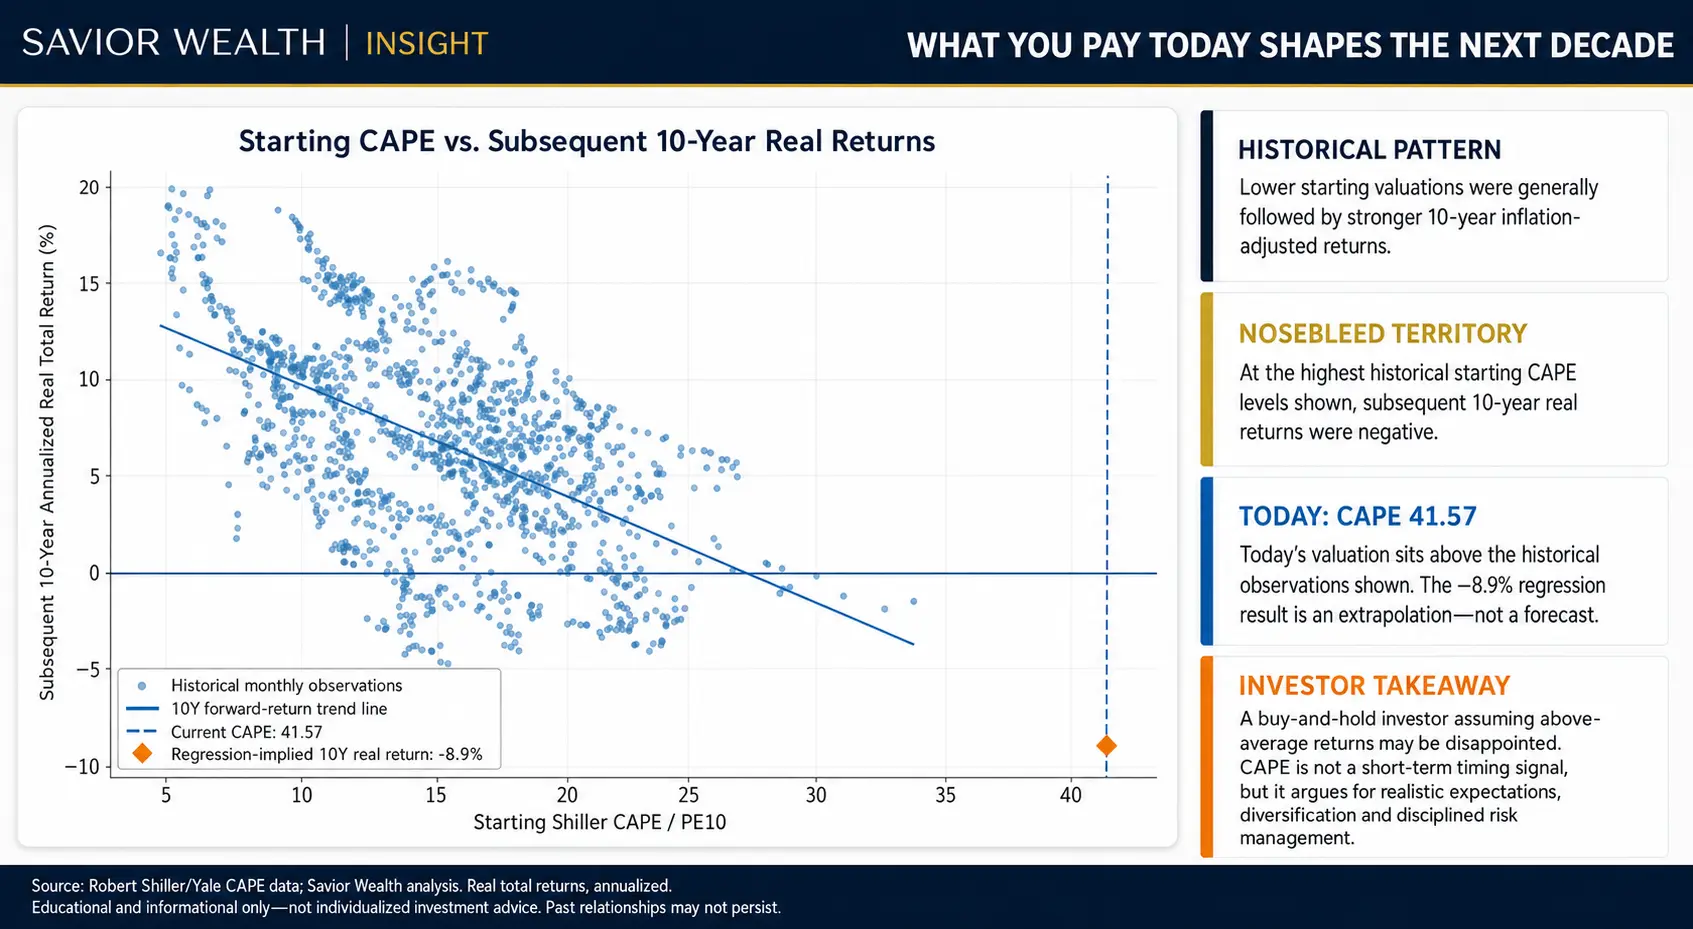
Valuation is not a clock—but the starting point still matters
Expensive markets can remain expensive, so valuation is not a reliable way to time next week or next month. The more important question is what a high starting valuation may mean for the next decade.
If a retiree begins by withdrawing 4% and future returns arrive below average—or early losses occur before recovery—sequence risk can put a plan under pressure. Historically elevated CAPE, Buffett Indicator, and price-to-sales readings do not guarantee failure, but they leave less room for disappointment and make diversification, spending flexibility, and disciplined risk management more important.
What to Watch Next Week
Key questions
- Breadth: Can equal-weight resilience become durable participation?
- SPY: Does price hold support and challenge resistance with better volume?
- Technology: Do semiconductors and megacap AI leadership stabilize?
- Credit and volatility: Do spreads and VIX remain calm?
- Rates, oil, and earnings: Do financing costs and capex commentary add pressure?
Improvement would look like
Broader participation, stronger SPY/QQQ momentum, a confirmed breakout with volume, calmer yields, and credit spreads that remain contained.
Deterioration would look like
SPY losing support, technology breadth eroding, Treasury yields and oil rising together, credit spreads widening, or volatility confirming the equity weakness.
Resources, News and Savior Highlights
- Savior Weekly Market Movers Review
Full company attribution, leadership, and market-cap detail. - Savior Market Structure Dashboard
Breadth, sectors, subsectors, leadership, and rotation. - Savior SPY Pattern Lab Report
Technical chart, pattern read, support, resistance, and confirmation. - Savior Daily Compass Dashboard
Current live score and daily market context. - Savior Bonds & Interest Rates Dashboard
Treasury, duration, curve, and bond-market context. - Savior Fixed Income & Credit Dashboard
Investment-grade, high-yield, spreads, and funding. - Federal Reserve Economic Data (FRED)
Public macro, rates, credit, and liquidity series. - Yahoo Finance Market Data
Public market prices, returns, and company information. - Advisor Perspectives / dshort
Long-run valuation and market-history research. - Savior Audio Briefings & Explainers
Podcast and explainer versions of selected research. - Subscribe to the Compass
Receive future Compass updates. - Schedule a Private Discovery Session
Discuss how the framework may fit a broader financial plan.
Research Context and Data Freshness
The authoritative Weekly Compass reading is the completed Friday-close score of 59.9/100. The Daily Compass Dashboard updates on a separate intraday cadence and may therefore display a different reading. The latest completed trading day for the market contracts is 2026-07-31; that trading-day anchor is preserved if the report is rebuilt on Saturday, Sunday, or after a market holiday. Weekly Market Movers used 417 of 503 constituents. Day-by-day asset values come from dated observations; a market holiday is shown as unavailable rather than fabricated. Public figures are rounded, attribution estimates may not exactly equal an ETF price return, and small timing differences can occur among market-close and Federal Reserve observations.
Summary
The Savior Market Conviction Compass is a rules-based framework covering breadth, trend, volatility, credit, sentiment, leverage, macro conditions, and valuation. For the week ending 2026-07-31, it registered 59.9/100 — Neutral / Hold and rose 0.9 points from the prior published weekly reading. Leadership remained concentrated despite positive participation. Advancers outnumbered decliners 243 to 174, but cap weight returned +2.42% versus +0.82% for equal weight—a 1.60 percentage-point advantage. The top 50 contributed +2.386 points while the bottom 450 added +0.033 points. The largest companies drove most of the advance. The practical focus is confirmation: breadth, technicals, credit, volatility, and leadership should be assessed together before conviction changes.
Important Disclosures
This material is provided by Savior Wealth for educational and informational purposes only. It is not individualized investment, legal, accounting, or tax advice and is not a recommendation to buy, sell, or hold any security. Market indicators, technical levels, scenarios, and historical relationships are research aids—not predictions or guarantees. Investing involves risk, including possible loss of principal. Past performance does not guarantee future results.
Information is obtained from sources believed to be reliable, but accuracy and completeness are not guaranteed. Consider your objectives, time horizon, liquidity needs, tax circumstances, risk tolerance, and overall financial plan. Consult the appropriate professionals regarding your individual circumstances. Important Disclosures